The CDH is one of the most mainstream big data platforms which packages well all the related big data tools into one environment and make you safe hours installing everything from scratch.
Meanwhile, Cloudera Manager is also one of the benefit of using CDH because it really gives you a handy GUI for you to monitor and even configure the environment.
Cloudera uses tsquery to pull the time series data regarding certain metrics. Say for example, there is a metric called “cpu_user_time”, it has an interesting unit of measure like “seconds/second”. It took me quite a while to double check all the numbers to finally understand what it means, but it is basically the cumulative CPU time across the multiple cores or even nodes. Say you have 3 datanodes and 12 cores each. Assuming your job is really stressing the cluster and we have 3*12=36 cores running in parallel at the same time, then at that moment, we are supposed to have a “cpu_user_time” under your account that has a value of 36seconds/second. Of course, when talking about CPU usage, a percentage between 0% and 100% is probably more straight forward which 0% means completely idle and 100% means fully utilized. In that case you can write a tsquery to be something like this:
select cpu_user_time / getHostFact(numCores, 1) / {numberOfHosts} * 100
Here getHostFact(numCores,1) will return the number of cores and use 1 as default value is not available. I have not figured out how to retrieve the number of hosts/data nodes using tsquery but you should get the idea, 100 turns decimal into a percentage that is more user friendly.
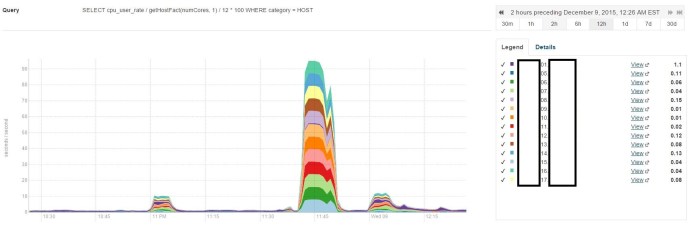
As you can see, I have 14 nodes in this environment and two of them acted as the name node and backup name node, that is why when I write my query, I divide by the number 12.
well. the next step is to do some scientific research figuring out what is the CPU usage across time, something like the integral of the CPU usage across time over the total timeline or simply the average if the distribution is even.
