It is very important to understand how fast is your Python code so that your ml endpoint is fast and efficient. In the modern ML application deployment, endpoints are usually deployed inside a container, the speed of your “def predict(input)” function usually directly determines your throughput and cost. To put it in plain words, your inference service might cost you $100K a year at the latency of 200ms. If the performance reduced to be 400ms, expect your cloud cost will simply double. (there could be opportunities where io bounded and CPU bounded steps are decoupled into different microservices to improve the efficiency)
Here is a list of ways to profile:
First, we need to have a simple block of code to profile, in the following block of code, we created a function myfunc that will call three different implementations of summations, between each call, there will also be a short period of sleep that varies between 0 and 3. And myfunc will be called in total 5 times. The expectation is that after the script got profiled, we will discover the func_slow will take a significant amount of the execution and by how much.


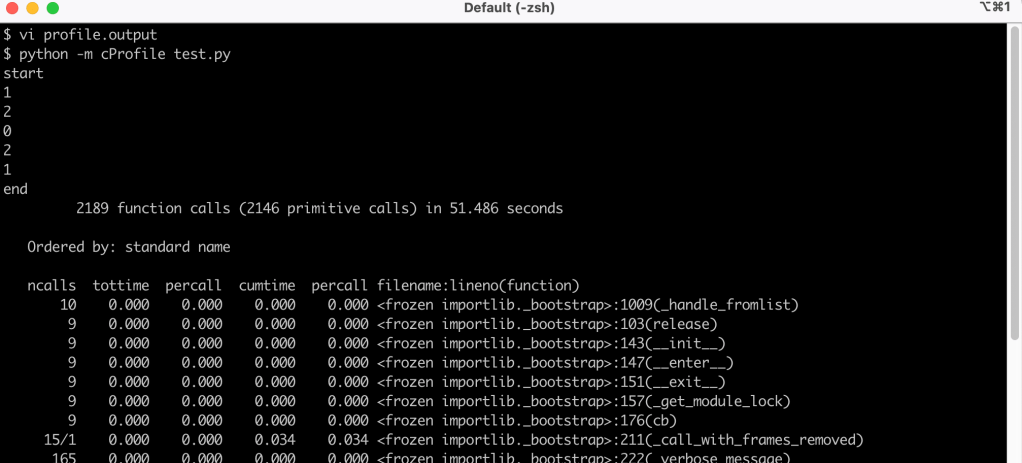
After the cProfile command is executed, the output will be dumped into a separate file profile.output which can be fed to other tools to analyze or visualize.

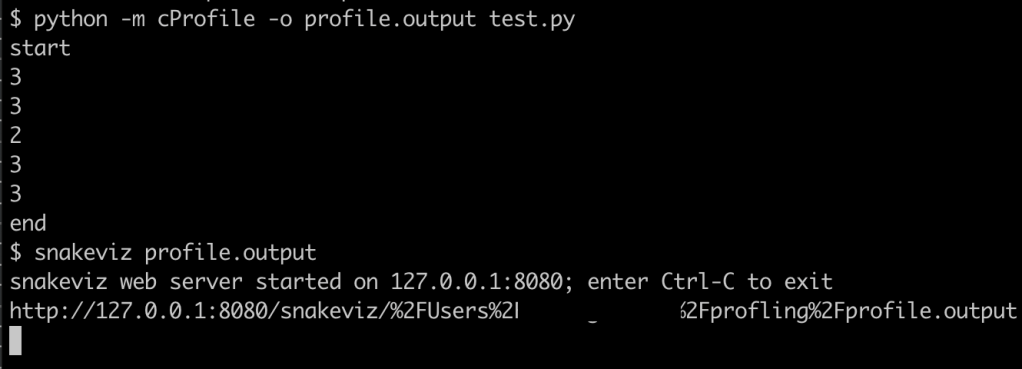
Sometimes the output is a bit hard to interpret and we will like to visualize. There is a lightweight tool called snakeviz that we can visualize.

If you are using an IDE like Pycharm, they have the functionality integrated.
