The true power of Coursera is not only the accessibility of its learning materials but also the true pressure from the deadlines! Deadlines of homework, deadlines of quiz and now is the timing of final!
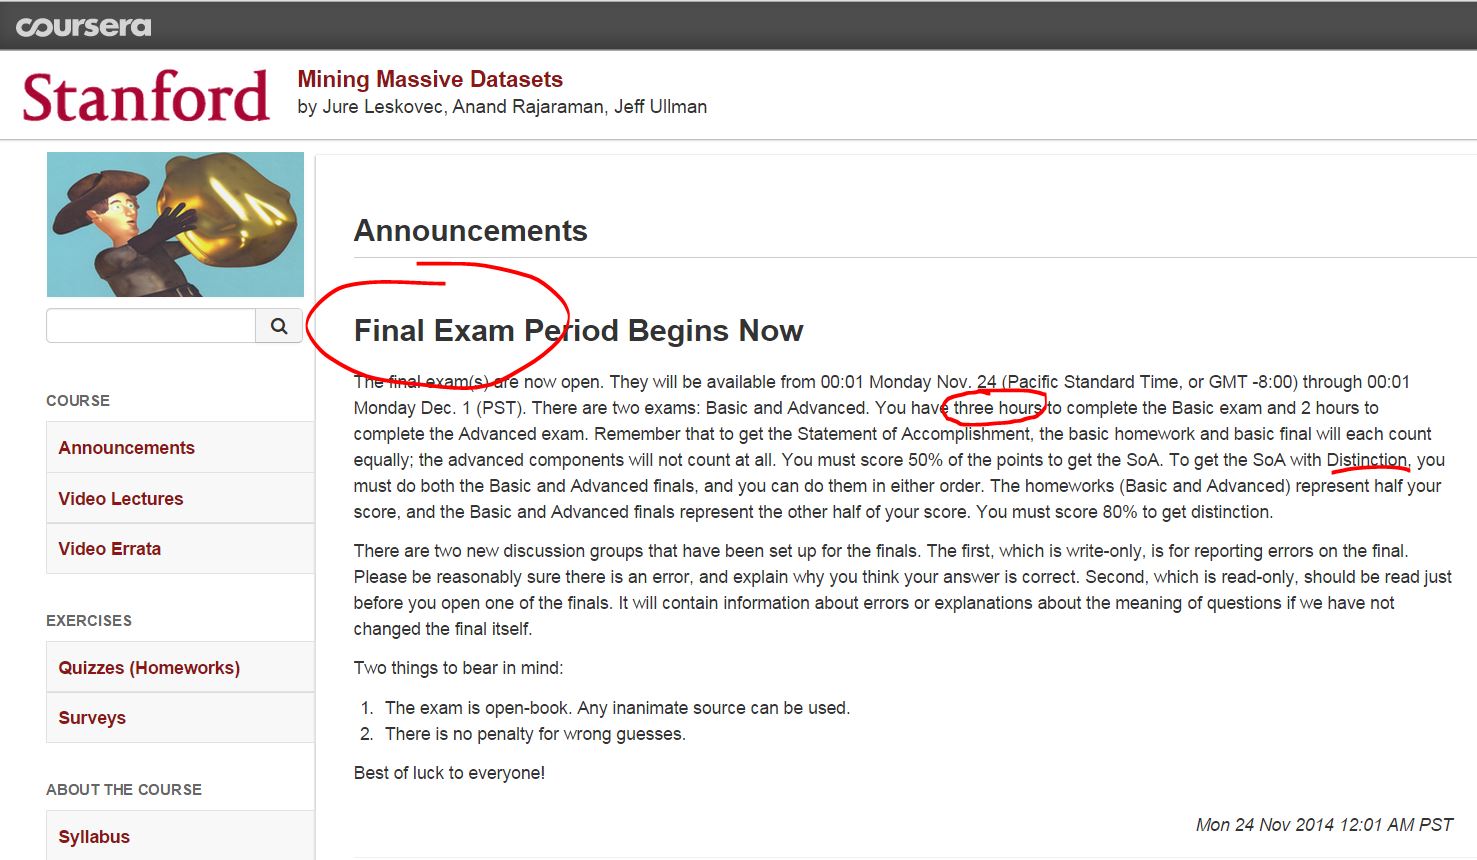
The true power of Coursera is not only the accessibility of its learning materials but also the true pressure from the deadlines! Deadlines of homework, deadlines of quiz and now is the timing of final!
I am writing a very basic hadoop streaming job where the mapper is basically to split each line into key and value, and the reducer to echo back the output from the mappers. This is a little bit different from just mapper-only job, it will do the big key-group. And the result will be order by key (not by value as default).
However, the progress from the command line is really confusing and it reminds me of all the criticism about windows installation progress bar, i.e, it is not linear at all!
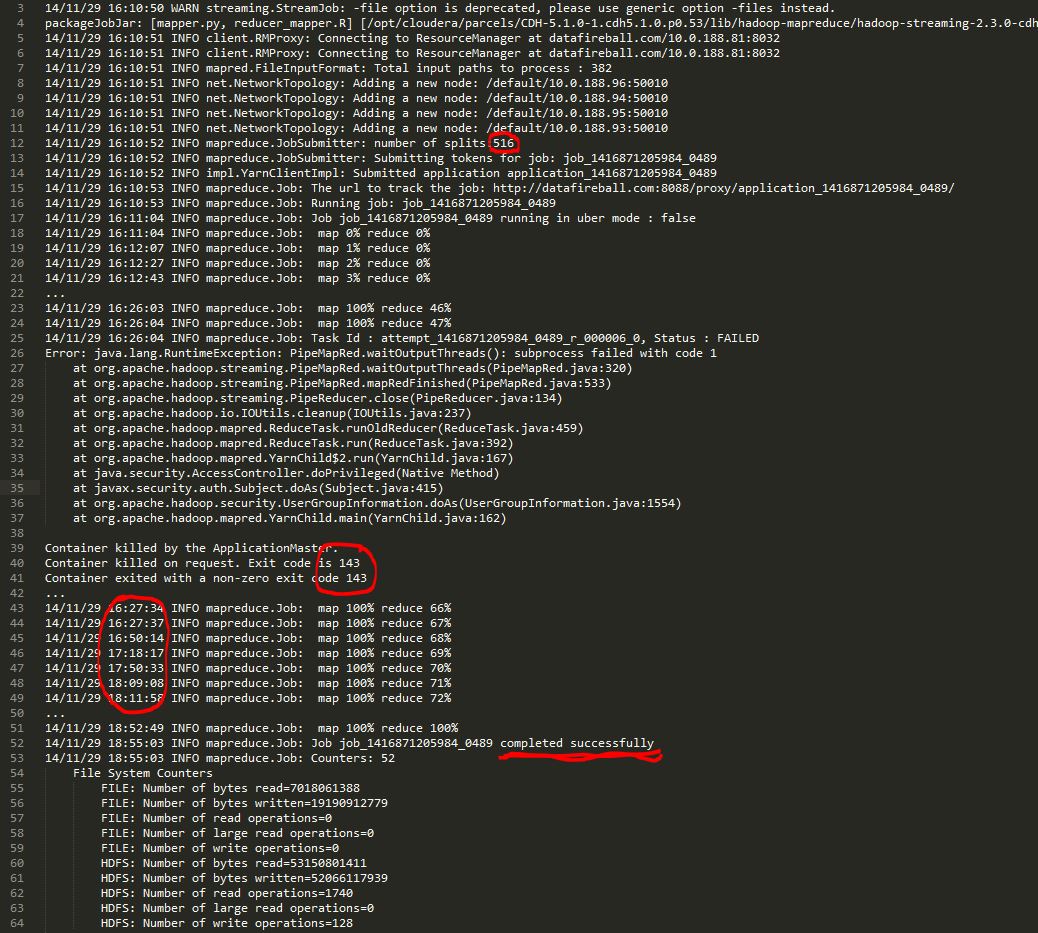
As you can see, the mapping part finished in about 10 minutes and And the reducer part finished “67%” very fast, however, it took about 20 mins to got to 68%, another 30mins to get to 69% ..then 10 minutes for each percentage. The whole job finished in about 2 hours which is acceptable but I am really confused and curious what is really going on during that time.
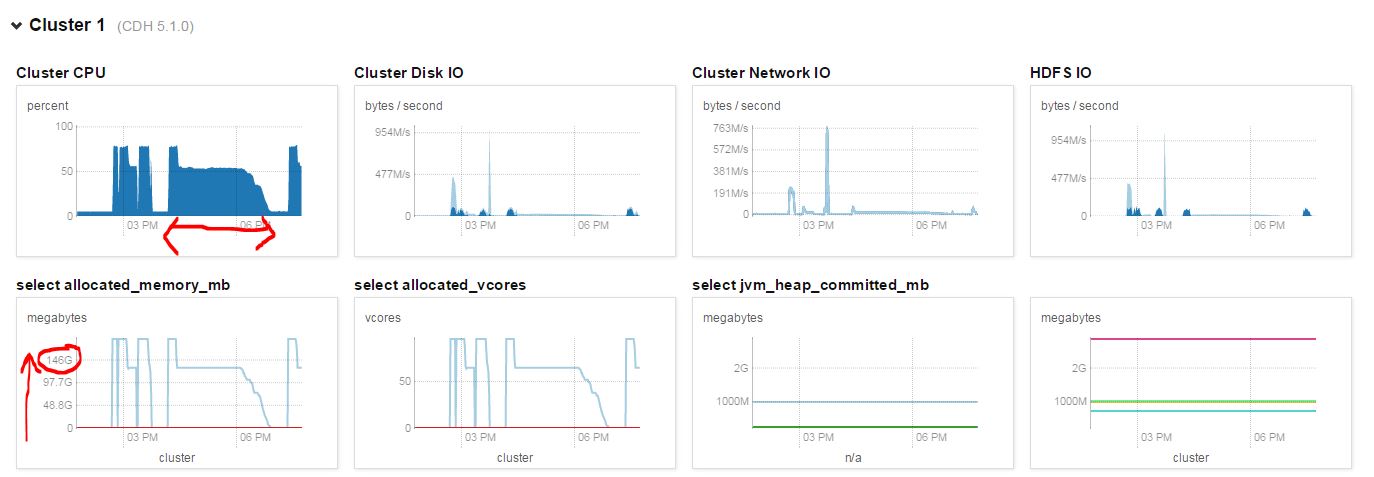
I pulled the cluster performance at that time and I can see the CPU was busy most of the time, which kind of proved that the cluster was not idle.
I also
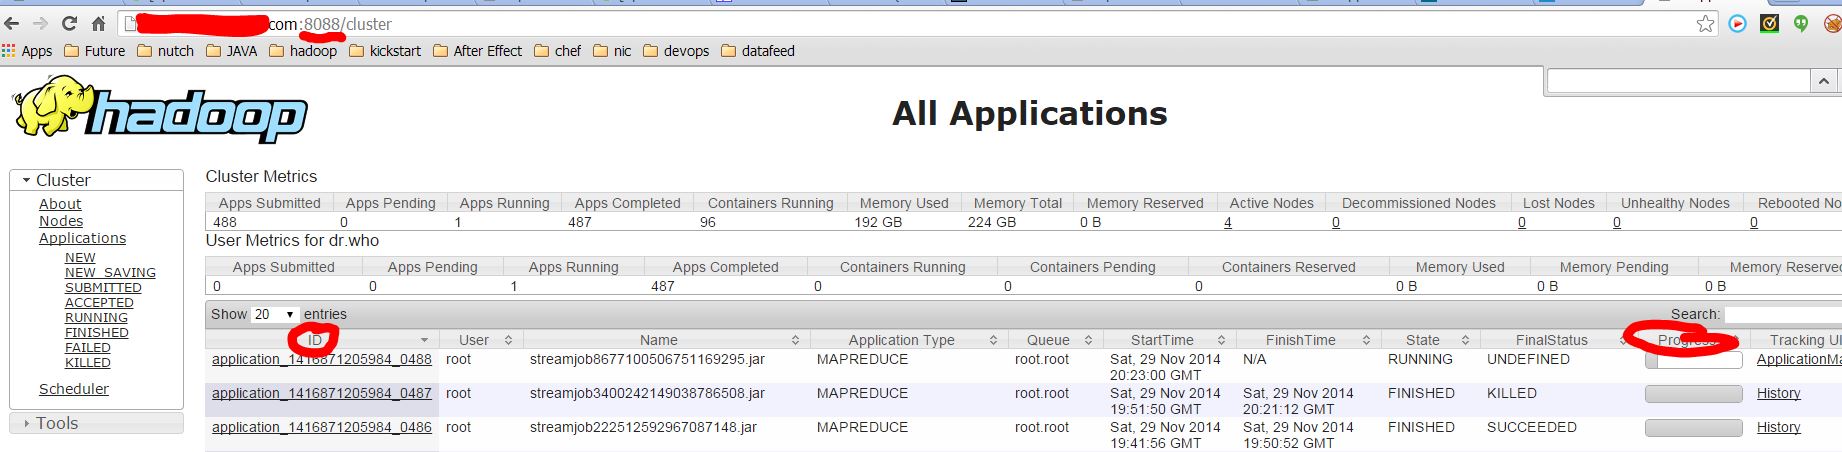
After you unleashed your mapreduce job, how could you monitor the progress of your map reduce jobs beyond the standard output from the hadoop it self.

An easy to monitor any types of map reduce job running on the cluster is go to the url: http://<namenode>:8088, which is the application dashboard for YARN. From there, you can dive into the nuts and bolts of each job, like how many mapper/reducers there are, how much progress they have made..etc.
If you are in the command line and hard-core enough to prefer command line. You can use the `hadoop job` command to manipulate map reduce jobs.

It has been 1 year and 10 months since I joined the forum Stackoverflow, the Q&A platform for programmers asking coding questions. The people there are helpful (I tried to avoid using the word friendly since they are professional and critical). I have been fairly active in a few tags like r, Python and data harvesting related. Today, it is a milestone of 3000 which is not only an acknowledgement for my activities in the community (174 questions and 130 answers), but also an evidence how the community helped me grow in my professional career. I don’t write diary but whenever I review my questions on stackoverflow, it reminds me of every project that I have been working on and sometimes I can even recall where I was while working on it, even with whom.
Anyway, big thanks to the community and big thanks to myself, I will keep using stackoverflow as a tool to hone my skills!

You are probably working with R inside Rstudio most of the time and most of your code is either interactive and disposable. In that case, you might not feel the importance of understanding R’s stdin and stdout that much. However, after I started learning running Rscript on Linux server, running Hadoop Streaming using R as reducer or mapper, it forces you to understand how stdin, stdout and stderr work.
As you can see from tldp, there are always three files in Linux, and lets first start with stdout.
STDOUT:
In Hadoop streaming, the information is passed through each stage through stdin and stdout. In that way, if you don’t have proper logic to control the cleaness of your output, random output from third-party functions might be added to standard output in which totally screw up your code. SINK() is definitely a function that you have to learn, which will “direct the output to a file”, the file here could be a txt file or csv file, it can also be “/dev/null” or NULL(default as “stdout”). So to make sure your Hadoop Streaming only outputs the content you want. You can use sink function to suppress your output, i.e., diverts all your output to /dev/null. And only open the output right before you wants to write output and remember to switch back after that. Here is a tutorial from weblogs.java.net which I found super helpful to read through a hands-on example.
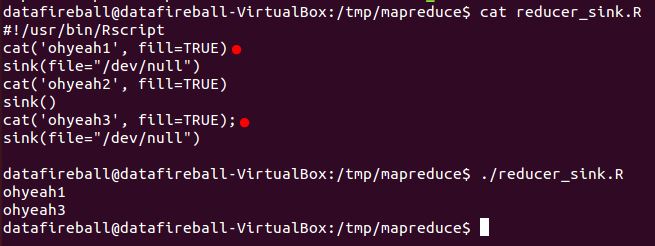
(This is a screenshot of a very short example demonstrating how to switch on and off output)
STDERR:

Error handling in R is super important in the process of writing a robust Hadoop Streaming job. However, maybe R users might found the error handling, or actually the documentation of error handling is not that straight-forward. Here is a great tutorial from WorkingWithData showing the ins-and-outs of the tryCatch function in R.
I am trying to understand how they implemented tsoutliers, and you can easily access the source from a CRAN mirror here, and this package is mostly based on this paper “Joint Estimation of Model Parameters and Outlier Effects in Time Series“. Lets first start with the function “locate-outliers”.
There are a few parameters here
Before compute the test statistic of outliers, we have to first estimate the residual standard deviations since they are easily contaminated by taking outliers into consideration, as indicated in the paper 1.4 (Estimation of Residual Standard Deviation). They mentioned three approaches to have a better estimation.
In the code, they first calculated the sigma and then called the function `outliers.tstatistic` to calculate the test statistics. The outliers.tstatistics will be explained in another post but let’s assume that we have the metrics ready for every single data point in the time series where they “type”, “indices”, “coefhat” (least squares estimate for the effect of a single outlier) and tstat (maximum value of the standardized statistics of the outlier effects).
Then they removed the rows whose tstat is lower than the cval (threshold, 3.5 as default).
They also mentioned a scenario where consecutive LS outliers have been found. And they will only keep the one with the highest abs(tstat).
Also, a point might be categorized as many types of outliers, where they will choose the one category where it exceed cval and also has the highest abs(tstat).
Then following two big for loops, iloop and oloop.
This is a paper by Box and Tiao from American Statistics Association.

It was a lot fun writing math equations in Lyx, which is a document processor which include not only restricted to Latex.

When I looked at the responses to step and pulse input, it really solves the puzzle, it reminded me of the my sophomore class.
This is a python library who claims to “Python wrapper for global input hooks in Windows. The package provides callbacks for mouse and keyboard events; events can be monitored and filtered.”. It is hosted on Sourceforge and you probably also need to download pythoncom(which comes with pywin32) just to make the example work. After you started the python job. You can see all your mouser and keyboard activity has been logged! You can even see in the console that your activities have been printed to the stdout as shown in the example. I changed the function to only show the keyboard activity and convert the captured event to readable character. I guess this could be a double-blade sward that could either be used as a hacking tool or be used to capture your keyboard activity and a source to capture tons of data to do interesting data mining.

My activity of searching for keyword pyhook in google has been logged.
Again, it started from a Stackoverflow question. I heard of the package Rcpp before and I have learned C++ for a few semesters while I was in college, however, I have never quite use C++ after I graduate and neither did I ever think of connecting it with R. I guess it will be an interesting weekend project to do some research how Rcpp works.
This is an article from JSS (Journal of Statistical Software) which basically talks about the ins-and-outs of Rcpp since it was first initiated at 2004.
First, you have to make sure you are using the right compiler if you are trying to compile any code/package from source. There are a few configurations you can tweak to choose between compiler flavors like clang, gcc..etc.

