Fixed Loan Monthly Payment Calculation

Usually people come across various forms of loans in their lifetime, which the mostly commonly seen in the USA are fixed rate loan for automobiles or houses. There is usually a fixed payment each period and by the end of the loan, all payments including interests and principals will be paid in full. However, how is the monthly payment calculated?

If you got a quote from the lender, the quickest way is to use some online calculators for mortgages and pretty much everything is a plug and play. In order to derive the equation on your own, there are also a few approaches. And here I am going to cover some of them. Using a financial calculator, using time value of money and the hard core way, derive the monthly payment using the definition of loan.

1. Using Texas Instrument BA II Plus financial calculator

It is pretty easy to use the financial calculator to calculate the monthly payment. I uploaded a Youtube video.

You can also quickly check with the calculator in Google to confirm the calculation was right.

Screen Shot 2018-10-28 at 9.41.48 AM.png

2. Time Value of Money

In finance, people like to evaluate the intrinsic value of an asset to be the net present value of all future cashflows. In a 30 year fix rate mortgage with equal monthly payment, we can assume that the monthly payment has the value pmt. And for the payment at period N, the net present value of pmt should be discounted using the internal rate of return which should be period interest rate, monthly interest rate.

For example

NPV(pmt_12) = pmt / (1+r)^(12) where r = Annual Interest Rate / 12

In this case the net present value of all future cashflows will be sum of all monthly payments.

Screen Shot 2018-10-28 at 4.21.11 PM

3. Monthly payment derivation

Screen Shot 2018-10-28 at 9.34.59 AM


put the numbers into the equation, we got the right result.

Screen Shot 2018-10-28 at 4.27.22 PM.png

LIFO Reserve

LIFO(Last In First Out) is a commonly used inventory recognition method, mostly in the United States. It will assume that the latest inventory will be sold first from the accounting perspective, not necessarily physically. Since the inventory cost usually varies, in that case, even for the same physical goods and same resale, different ways of recognition the cost might lead to different financial performance on the paper. LIFO is said to have positive impact on the cashflow when inventory’s cost are uptrending because recognizing expensive cost will reduce profit, hence, less tax.

This article will focus on a terminology which is called LIFO reserve. It is defined to be the difference between inventory amount recognized under two different methods LIFO and FIFO. By having LIFO reserve, inventory value and COGS under one method can be converted to another easily.

Now let’s see how to adjust some of the numbers when compare a company reported under LIFO to the ones that aren’t.

INVENTORY:

The inventory amount under LIFO will need to add the LIFO reserve in order to reach the inventory amount under FIFO

COGS:

COGS under LIFO should subtract the increase in LIFO reserve to reach COGS under FIFO

Now let’s explain why, we add a number to the end of each variable to represent the year, XXX_1 means year one, so on and so forth. Based on the definition:

LIFO_reserve_1 = inventory_FIFO_1 – inventory_LIFO_1   (Equation1)

LIFO_reserve_2 = inventory_FIFO_2 – inventory_LIFO_2   (Equation2)

inventory_FIFO_2 = inventory_FIFO_1 + Inventory Bought_FIFO – Inventory Sold_FIFO (Equation 3)

inventory_LIFO_2 = inventory_LIFO_1 + Inventory Bought_LIFO – Inventory Sold_LIFO (Equation 4)

Under different methods, inventory bought is the same because it is fixed money paid for new inventory. The wiggle room is that inventory sold can be adjusted depends on which inventory you assume to be sold.

By subtracting Equation 4 from Equation 3, we have

inventory_FIFO_2 – inventory_LIFO_2 = inventory_FIFO_1 -inventory_LIFO_1 – Inventory Sold_FIFO +Inventory Sold_LIFO

Rearrange it,

Inventory_Sold_LIFO – Inventory_Sold_FIFO = (inventory_FIFO_2 – inventory_LIFO_2) – (inventory_FIFO_1 – inventory_LIFO_1) = LIFO_reserve_2 – LIFO_reserve_1 = increment_LIFO_reserve

In one of the CFA Level1 practice problems, there is a problem which well explained how everything fits together.

Screen Shot 2018-10-20 at 11.26.06 AM

The return on assets under LIFO for 2014 is 178/5570 = 3.2%.

Under FIFO, we need to adjust (increase) not only the net income due to the decreasing profit but also increase the asset by adding up the LIFO reserve. Both the numerator and denominator will increase by to different level.

Net_Income_FIFO = Net_Income_LIFO + LIFO_reserve_change adjusted by tax

Total_asset_FIFO = Total_asset_LIFO + LIFO_reserve_2014 adjusted by tax

Net_income_FIFO/Total_asset_FIFO = Net_income_LIFO + (867-547)*(1-t) / [Total_asset_LIFO + 867 * (1-t)] = (178 +(867-547)*(1-33.3%)) / (5570 +(867)*(1-33.3%)) = 6.4%.

The return on asset pretty much doubled under FIFO.

(867-547)*(1-33.3%)) / (867)*(1-33.3%)) = 36% which is pretty high. In that case, by analyzing the LIFO reserve, especially, the change percent in the lifo reserve and how much lifo reserve relative to total asset will give you a good picture of return on assets under different methods.


A Brute Force way to Auto Detect Signs in Financial Statements

When reading about the financial statements for any given company, or any spreadsheet in general, a situation any person constantly run into is numbers are presented in a slightly inconsistent way regarding the signs (+/-). For example, if there is an expense line item, people might assume it is an expense (outflow of cash) and will present the way as is. Sometimes, people will actually consider expense is different from income and will present it in a different way from revenue by including the numbers in a brackets like (400). Things can get really complex because there are metrics derived from a series of basic metrics like net income (bottom line on statement of operations) which should be the ultimate result after adding/subtracting the relevant gains and losses. I always have a hard time by calculating the final results because the signs for each line always confuse me. In the end, I ended up playing with signs for each line with my fingers crossed, wishing that I will be “lucky” enough to make the math work.

Screen Shot 2018-10-06 at 10.37.44 AM

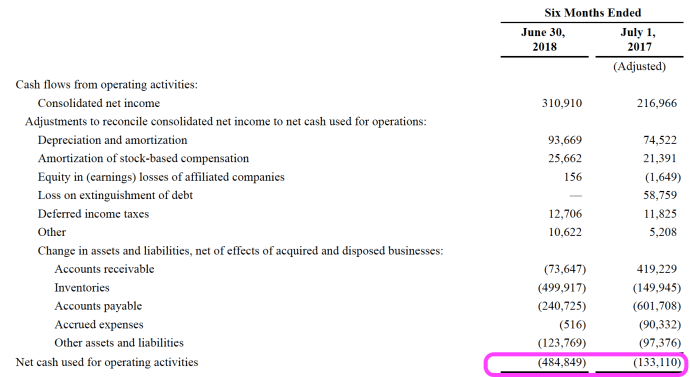
Above is part of the cashflow statement from unaudited 10-Q for Arrow Electronics, Inc., a public listed company. They did a great job because the bottomline for the cash used for operations are a simple arithmetic sum of all the number, given you treat numbers in parenthesis as negative, hence to subtract.

Screen Shot 2018-10-06 at 10.42.19 AM

However, I want to use this data as an example to see how my script will be able to “auto detect” that the numbers in parenthesis should actually be subtracted. The Python script will take a brute force approach to find the right signs for each line item in order to reach to the right “bottom line”. The idea is very simple, it will switch signs for each line (positive, negative or exclusion) until it finds all the right sign and approximate to the bottomline within certain error tolerance.

Now let’s take a quick look at the implementation.

Screen Shot 2018-10-06 at 10.55.48 AM

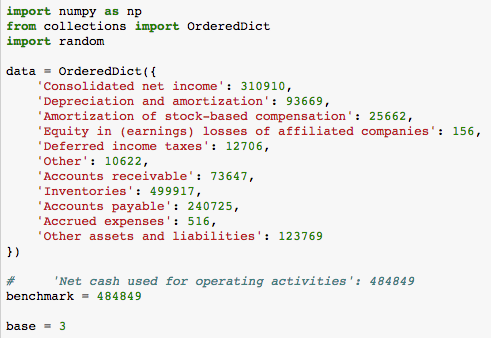
First, we load all the data points into a data structure, since we are not sure about the signs for each line, or even should we include one line item or notat all, we will treat them all the same as positive numbers to get started. Benchmark variable is the final answer that we need to match. Base variable is 3 because for each number, it can either be treated as a positive number, a negative number or not included (for example, there could be an intermediate variable. Including the intermediate variable along with all the basic variables will lead to double count).

Screen Shot 2018-10-06 at 10.59.09 AM

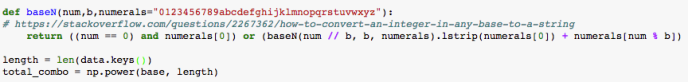
baseN is a utility function that I borrowed from Stackoverflow, it can convert from a integer into a string format representation of any base. For example, baseN(4, 3) will be 11. We will use this function to help us loop through all the possibilities.

Then the next step is to try out all the possible combinations. Frankly speaking, I should have done way more research than I did but the first thought that came to my mind is to loop through all the possible combinations and represent the each state as a number of base 3. For example, in total, we have 11 elements. Then we have a number of 11 digits which each digital can have three states (negative, not included, positive). It can be represented as (0, 1, 2) for each state. In that case.

00,000,000,000 represents a possibility where all numbers should be treated as negative and clearly the total sum will not add up to our benchmark. Then next,

00,000,000,001 represents a situation all numbers except “Other assets and liabilities” 123769 will be negative, and only 123769 will be excluded. And of course, it will not add up.

00,000,000,002 means treat the last number as positive leaving the rest as negative.

00,000,000,010 means treat the second to the last as excluded and the rest of negative.

So on and so forth, when the number keep increasing till 11,111,111,111, then we should have iterated through all the possible combinations, hence, np.power(3, 11) ~ 177K.

Screen Shot 2018-10-06 at 11.08.54 AM

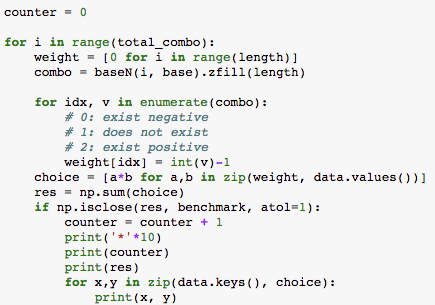
Weight is a variable that stores the sign for each variable. The code is pretty straightforward and I just want to clarify that the use of np.isclose is essential because all financial statements do some sort of rounding. It will be really hard to perfectly add up all the numbers and by tuning the error tolerance will be critical, something within 1% is probably a good rule of thumb.

Screen Shot 2018-10-06 at 11.14.32 AM

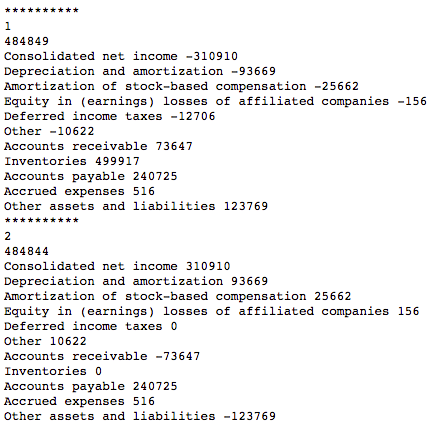
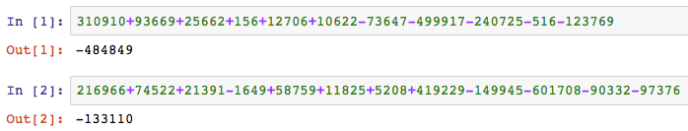
In the end, the final outcome will look like this, as you can see, since I am comparing using the absolute value, the script gives me two answers where it successfully identified the lines items under “changes in assets and liabilities” should be treated as a opposite sign as the rest of the items.

There are several limitations to my implementation just out of the box. The first one will be the scalability. The complexity of this brute force approach will grow exponentially as the number of variables increases.

Here are some interesting ideas for further exploration.

  1. How can you build mathematical relationship automatically within a financial statement or even across financial statement, across different years. For example, AR change in cashflow is the difference between end AR in balancesheet, ..etc.
  2. How can you solve the scalability issue by aggregating numbers to reduce number of variables, for example, now we can exclude all these 11 variables from future computation because they can be replaced as one variable – Net Cash used for operating activities.


Antidilutive in EPS calculation

EPS (earnings per share) is a very important ratio in income statement, it is calculated as earnings (net income) attributed to common shareholders divide by common shares outstanding. Actually, it is so important that it is required to include EPS on the face of the income statement.

walmart_eps_10k

As you can see, they not only show the EPS, there is also another line right below it which is the diluted EPS. The reason that diluted EPS need to be disclosed to the public is that there are different kinds of equity like preferred stock, convertible stock that has the potential of “diluting” the EPS. How big a difference is can be? Usually it is pretty small, like for Walmart, the earnings per share is only 0.01 but in some cases, the difference can be material enough that investor want to know the potential downside.

Say for example, convertible stock sometimes got paid dividend and can also be converted to certain amount of shares. If not convert, that is the simple calculation for EPS, however, the diluted EPS to evaluate if all the convertible stocks got redeemed into common stock, on one hand, the net income will increase because the earnings that used to go to dividend now can be retained, on the other hand, the number of outstanding common shares also increased due to the conversion. In this case, there is a scenario where the diluted EPS if converted can actually be higher than the basic EPS, if this happens, the diluted EPS sort of loses its meaning of providing a good projection of the potential downside. Both IFRS and GAAP require that this kind of EPS – Antidilutive Security be excluded from the diluted EPS calculation.

Now, let’s do some simple calculation and see under what situation Antidilutive security could exist.

Say a company’s net income is I, number of common shares outstanding is C and number of preferred stock is P. The term for preferred stock is that the annual dividend paid per share is D and it can also be converted to X amount of common stock if wanted.

Basic EPS = (I – P * D) / C

Diluted EPS = I / (C + P * X)

The constrain is that Basic EPS >= Diluted EPS

(I – P * D) / C >= I / (C + P * X)

After a bit transform, we got: X*I – D*C – P * X * D >= 0

I like to rearrange it into the following format:

D <= I / (P + C / X)

This is easy to interpret, P+C/X can be interpreted as if all shared got converted into preferred shares. If the dividend is smaller than if all converted to preferred stocks, then it is dilutive. If not, then it is anti-dilutive which should be excluded. So in this case you can see, if the dividend for the preferred stock is too high, or the conversion X is too small, it is highly likely that the constrain will not hold and it will be anti-dilutive. Also, if the number of preferred stock is substantial, this will also become anti-dilutive.