Python – Profiling cProfile

Recently I have a project that I have lots of raw data (time series data), however, the output need to some higher level statistics which requires some aggregation of the raw data. So here are the choices that I have, either for every request, pull the raw data and calculate it on the fly, or preprocess all the raw data and store the stats somewhere else, so when use needs the data, then it is simply a look up.

Since the data is pretty big and updated at a daily level, batch preprocessing all the data is like boiling the ocean, and what is even worse, we need to reboil the ocean every day. There is also a possibility that the user who requested this service won’t even be able to use all that much data that frequent, which will result in a huge waste of computing power. On the other hand, calculating on the fly faces some other challenges, you need to ensure your logic is so well written and generic and will succeed for all the parts. Mostly important, the performance need to be fast enough to serve as a service. In the history, I wrote my python code in a style that “hmm, it is fast, hmm.. it is taking a long time”. Nothing more than a linux “time python script.py”. Now I face the challenge of turning whatever calculation into something that will be fast at a service level (<100ms). Have a quantitive understanding of how much time each step takes, where the bottle neck is and then we can strategically to improve certain parts without switching to other programming languages (C, Java)..

Then I learned that this type of analysis is called profiling:

“A profile is a set of statistics that describes how often and for how long various parts of the program executed.” – Python Documentation

The cProfile is the de-facto profiling tool to benchmark Python code. It is not the mostly user friendly tool but once you spent some time on it, getting familiar with its syntax, then you will have a tool like linux top command but for your python code.

import cProfile 
cProfile.run('range(10)')

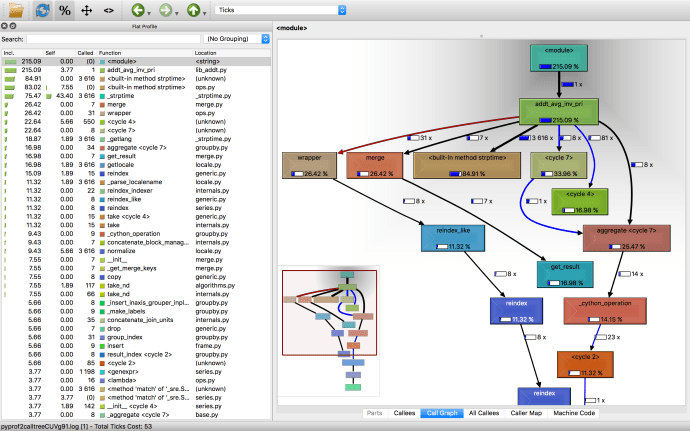
Either the python documentation or pyMOTW can help you get started quickly. Then I came across a blog post from Julien Danjou – Profiling Python using cProfile: a concrete case which introduced me to KCacheGrind.

If you are a Mac user like me, brew install everything following this instruction.

pip install pyprof2calltree, and then you will be good to go.

pyprof2calltree -k -i file_profile

In the end, you will have a beautiful visualized way of how long each step takes.

Screen Shot 2016-07-23 at 6.59.56 PM.png


Shell – Exclamation Mark !

The exclamation mark will definitely speed up your history look up. Usually people look up history by hitting the up arrow to go through the history commands. I literally have seen someone who hit the arrow sign more than 20 times and still wouldn’t be able to locate the exact command he was looking for.

Then there are some users there who uses the ‘history’ command to lookup history. One can either by copy paste the command, or you can find the command line number and use “!<number>” to execute the command.

Also you have people use command like ‘history | grep <keyword>’. However, if you happen to know the command you are searching for start with certain prefix or even contains certain keyword. You can use “!<prefix>” or “!?<substring>?” to quickly pull the last executed command that starts or contains the specified keyword.

(note: !xxx show in the history, the command it represents does)


$ echo 'hello'
hello
$ cd ~
$ !ec
echo 'hello'
hello
$ !hell
-bash: !hell: event not found
$ !?hell?
echo 'hello'
hello

Here is an answer on stackexchange that contains a more detailed explanation of use cases for exclamation!

Spring-boot: actuator default endpoints

Actuator is a sub-project of Spring-boot, which provides production ready features for spring-boot applications. It provides a number of additional features to monitor and manage the application when it pushes to production.

You can try it out by clone the spring-boot github repo, and navigate to the spring-boot-samples directory which contains plenty of built-in samples, you can find one that is called spring-boot-sample-actuator-log4j2, and run the command `mvn spring-boot:run` to bring up the spring boot application. 

Screen Shot 2016-07-03 at 10.41.36 AM

As you can see, there is not really any code in the project where defines this autoconfig endpoint. This “autoconfig”one might not be the most interesting or straightforward one, but it is actually a really important and sophisticated one which displays the auto-configuration report of all the auto configuration report, also which one is applied or not and why.

You can refer to spring-boot-actuator documentation for a complete list of the available endpoints. Here are a few ones that I tried out myself along with some description and screenshots to help you understand how that works in real life:

1.configprops – configuration properties

Screen Shot 2016-07-03 at 10.53.20 AM.png

2.health – heath status

application health information

Screen Shot 2016-07-03 at 11.05.00 AM

3. metrics – metrics of current application

If you are in a production environment, i think you should care every number in the response.

Screen Shot 2016-07-03 at 11.08.48 AM.png

4. mappings – display a collated list of all paths

Screen Shot 2016-07-03 at 11.14.37 AM

I pasted the response to a site called jsonlint to put it in a better format for human to read.

Screen Shot 2016-07-03 at 11.14.17 AM

5. shutdown – make a post to the server to shutdown

This is quite a dangerous endpoint that a post request to the server will shut it down.

Screen Shot 2016-07-03 at 11.19.02 AM.png

Well… here they are, enjoy the awesome work done and appreciate it.