GDAX is a cryptocurrency trading platform and it is a subsidy owned by Coinbase. They offer a great platform along with a suite of API services for easy access to the trading data – rear mirror historical view or real-time data.
I have used API before but GDAX suggests to use websocket instead of API for real-time data access.
API – LEVEL1
“Only the best bid and ask”
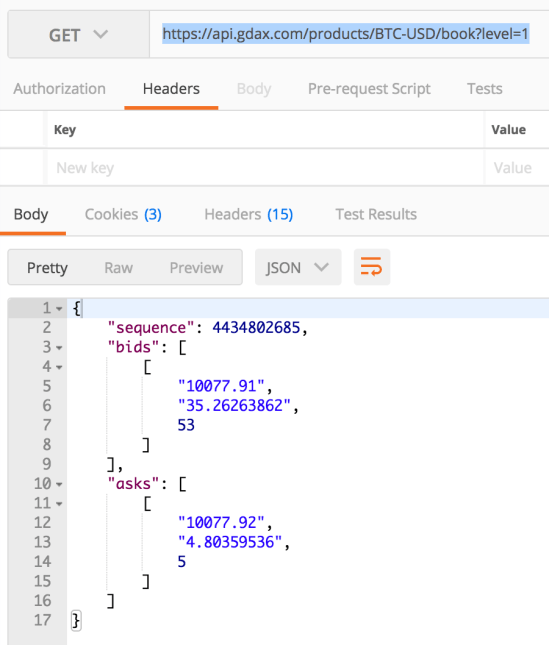
As you can see, on the trading platform, the best selling price (ask to sell) is 10077.92 USD/BTC and at the same time, the best buying price (bid to buy) is 10077.91 USD/BTC. There are 53 different orders bidding at the best bid price and the total bids size is 35.26 BTCs. Same for the asks.
API – LEVEL2
“Top 50 bids and asks (aggregated)”
At level2, instead of the top 1 (best) bid and ask orders, the API will return the top 50 bids and the top 50 asks. The data is in the same format [price, ordersize, numberOfOrders]. Given this information, you will have enough information to plot the depth chart (investopedia explanation).
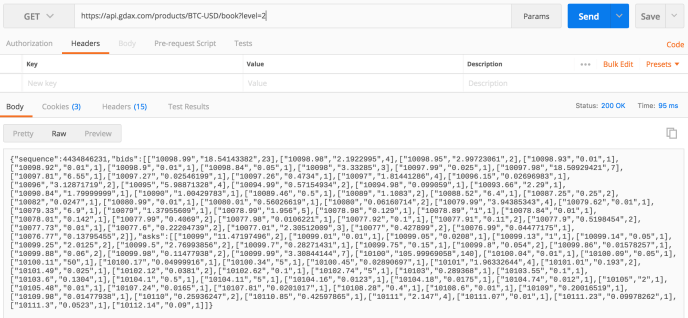
However, the price range is so small (10112.14 – 10076.77) / 10076.77 ~ 0.3% only a small small price range, which is not sufficient enough to draw a meaning depth chart.
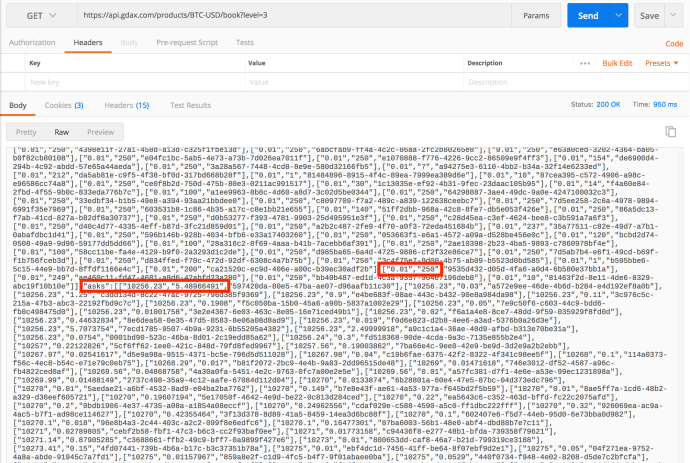
API – LEVEL3
“Full order book (non aggregated)”
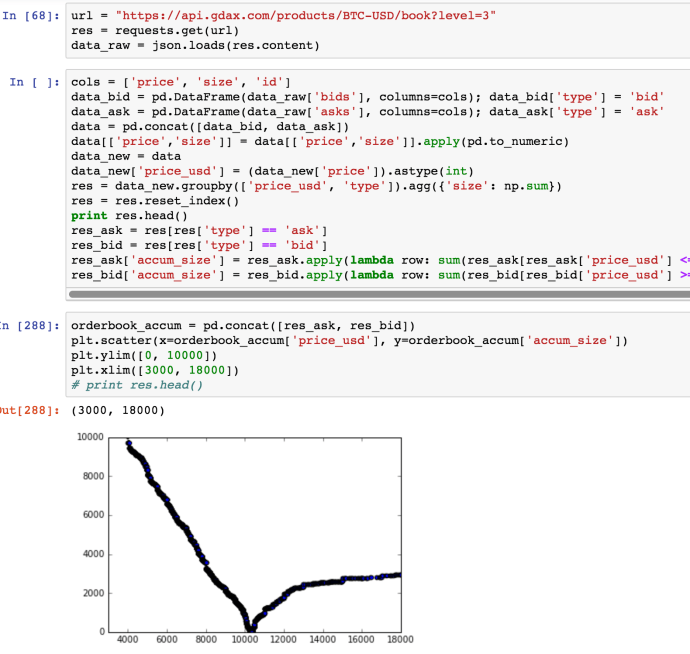
This is a BIG request, however, the information is quite rich and it a complete snapshot of the orderbook. Hence, the response format is slightly different where they do not have order size anymore because record is at order level without any aggregation, instead, they provided the order ID.
As shown in a snippet of the response, they even listed the bids out there at the price of 0.01 USD/BTC. Those bids are probably the ones either added to the orderbook years ago or those were the disbelievers. On the other size of the spectrum, you can easily see people even ask to sell BTC at the price of 9,999,999,999 USD/BTC, good luck to them 🙂
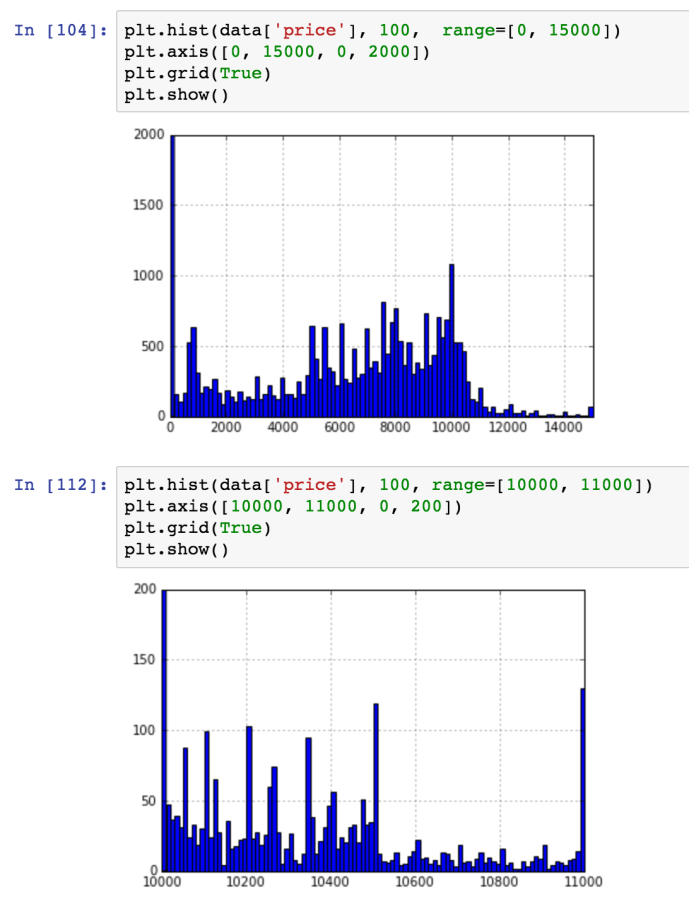
This is a plot of the histogram of how orders are distributed on different prices. As you can see, there are a few peak values out there. The biggest peak is definitely on the lowest point, maybe under a dollar. Then they have a few big peaks around $800, $5000, $8000 and $10000.
This is interesting but not necessary the depth chart that you usually see.
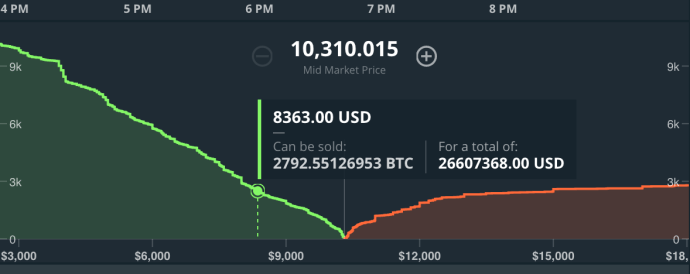
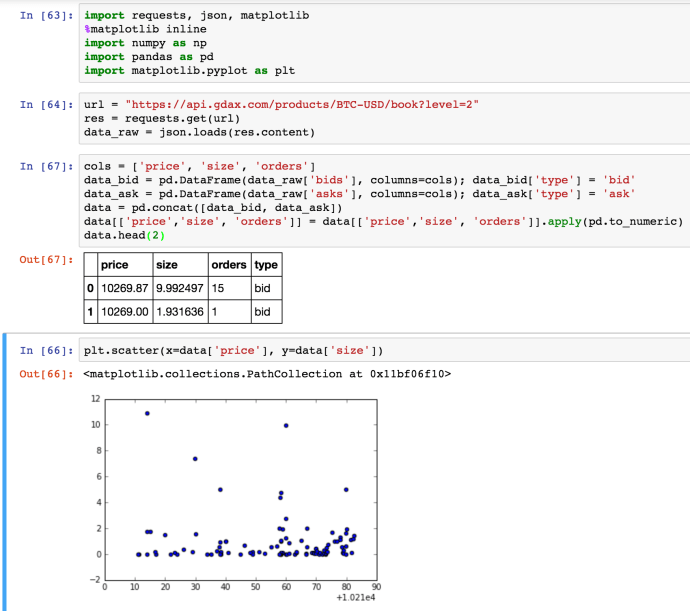
For example, this is the market depth from GDAX. And clearly, the X axis is still exchange rate of BTC and USD but the y axis is the number of Bitcoins at that price. I am not exactly sure of the resolution in this graph but let’s take a quick look and see if we can reproduce this graph in Matplotlib.
The code might not be the most efficient but it does but you want it to do.
WEBSOCKET
If you are on GDAX website, you can realize that your computer’s fan might be spinning a bit faster, behind the scene of numbers jumping up and down, you can the browser actually subscribed to the GDAX websocket to stream NRT trading information from their server to update the information on your website. And this actually the exact websocket that the developer manual suggest users to use to receive information feed.
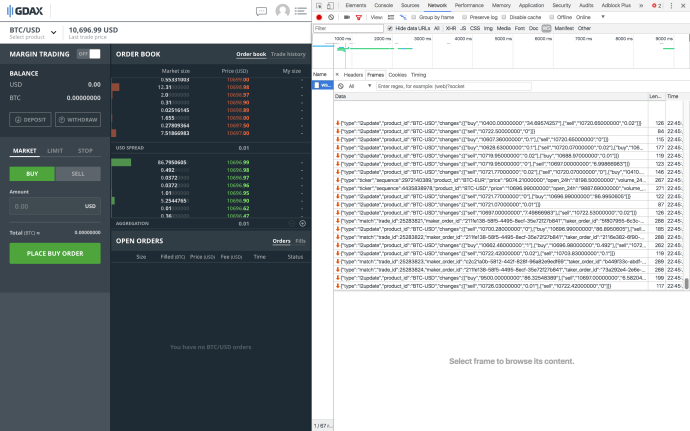
Of course, in this case, you will need to take the responsibility of parsing the information calculate the latest state and deal with everything yourself.
So far, you should have a rough understanding of what kind information are provided various levels of orderbook API from GDAX. We also briefly touched the GDAX websocket. In the next article, I am going to have a deep dive into the websocket data types and message format, hopefully, we can cover Mongodb in more detail regarding how to query the transaction information and gain analytics.
