First, and the most horrible one when you have so many points:
data = data.frame(x=rnorm(1e4), y=rnorm(1e4))
plot(data, pch=19)

smoothScatter(data)

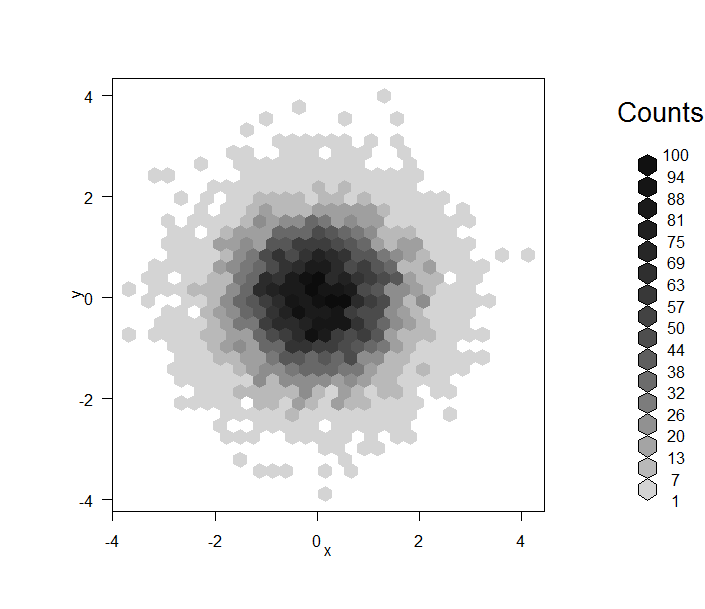
library(hexbin)
plot(hexbin(data))
library(ggplot2)
ggplot(data, aes(x=x,y=y)) + geom_point(alpha=I(1/3))

