library(d3Network)
Source <- c(“A”, “A”, “A”, “A”, “B”, “B”, “C”, “C”, “D”)
Target <- c(“B”, “C”, “D”, “J”, “E”, “F”, “G”, “H”, “I”)
NetworkData <- data.frame(Source, Target)
# Create graph
d <- d3SimpleNetwork(NetworkData, height = 300, width = 700, fontsize = 15)
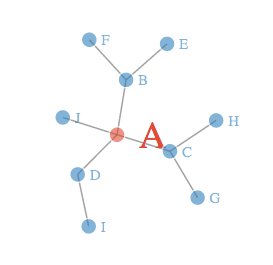
Will generate a html file that contains all the data. You can open up the file in your browser and you will see an interactive plot with a few nodes.
It is also a lot of fun to drag and yank the node here and there.
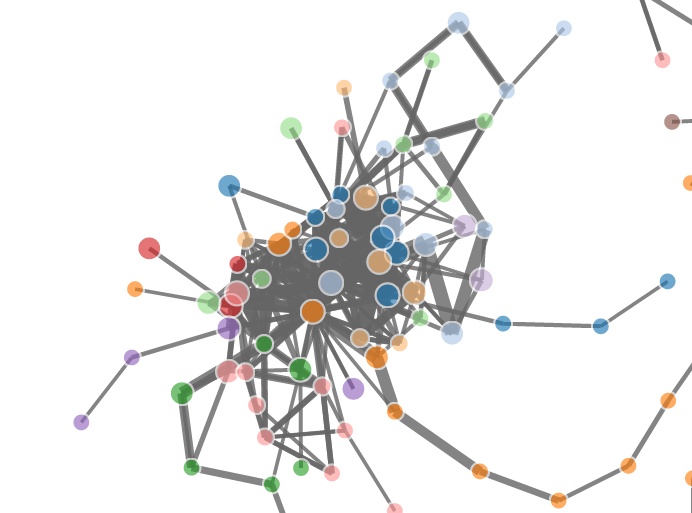
It is also really amazing that how much data this package can handle, here is a post from R-bloggers that show you a few graphs with more data points.