Seeing the dead end of paying out an API to query all the companies, I decided to give my luck a try. There must be some sites which has the beautiful csv file that I have been looking for somewhere on the internet. Don’t give up!
This post will be a quick documentation of how I found a public dataset about stock prices from Kaggle and most importantly, how to observe and get the data into a clean format in a database for later research.
1. Download
Frankly speaking, there are indeed so many places where you can possibly scrape the data off if you approach it carefully, at the same time, there are also data sets on Quandl / Quantopian where you still have to be a premium user in order to use it. However, after some research, Kaggle – this community where data analysts/developers banging their heads against difficult machine learning problems indeed has the solution for me.
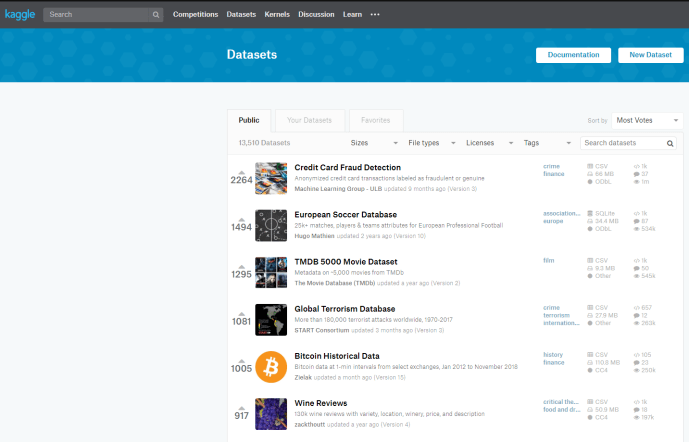
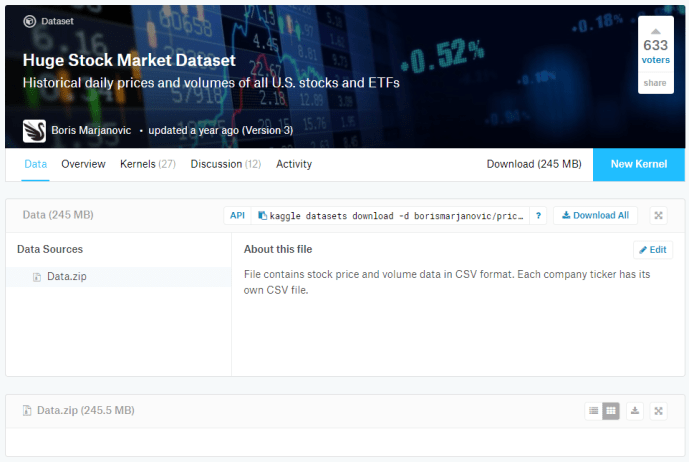
They a datasets repositary where some really cool data were published in public. After a quick search, you can find several datasets related to equity prices and some even with the financial performance for those companies, the fundamentals, that we can play with later, for now, our focus will be the “Huge Stock Market Dataset”
2. Extraction
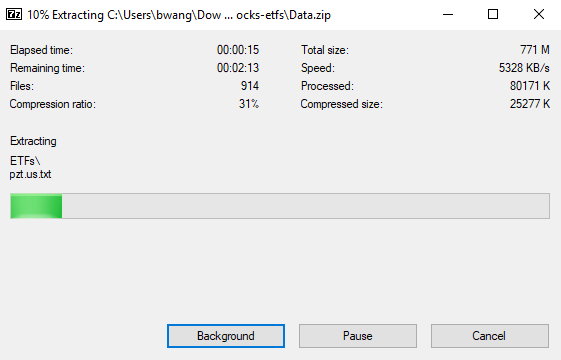
The data has a decent size and I will kindly warn those windows users who uses the default compression/decompression program, it will be slow for you. I have a pretty old HP desktop and it was decompressing the file at a ~1MB/s speed, that will take me tons of time. I highly recommend 7zip which is a free archive application that can totally deals with commonly use compression format. And for me, it was 5 times speed time.
3. Format
First, let’s take a quick look at the dataset. The uncompressed format is about ~770MB that has 8500 files. It is categorized into two folders, the ETF and the Stock:

The data is structured in such a way where each symbol/ticker is a individual text file on its own, and all following the format of symbol.us.txt format.
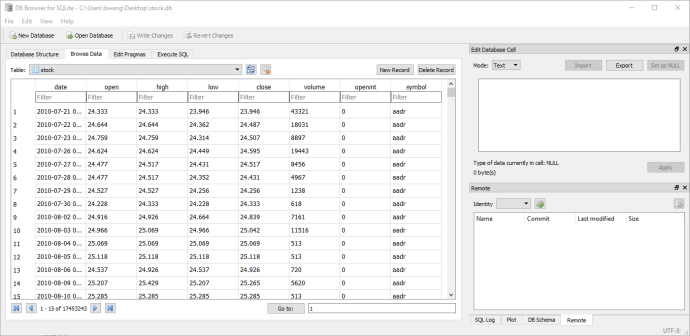
Let’s take a look at Apple’s data file to understand the file structure.

It looks like a pretty classic CSV (common separated file) contains the daily prices since 1984-09-07. It indeed goes back a long time but Apple issued its IPO on December 1980 so I don’t think this dataset contains all the history. Another quick check is to understand if the stock price has been adjusted, in a way where whenever there is a stock merge/split, the price is baselined or normalized for analysis purpose. If not, our analysis might take the risk of reaching to the conclusion where the stock price dropped by 50% which in fact, it is merely a 2-1 split.
By visiting Apple’s website, you know they have issued stock split 4 times, 1 time for a 7-1 split and the rest is 2-1.
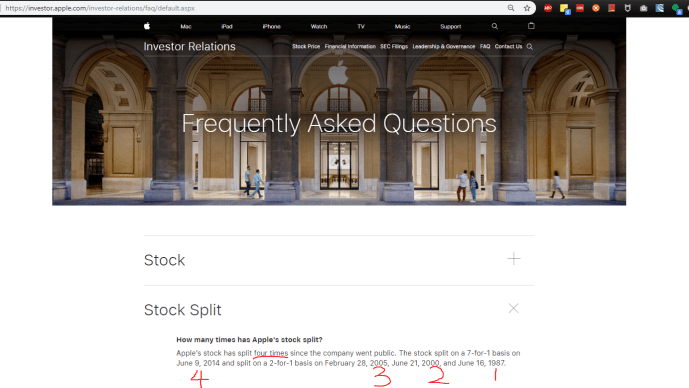
So theoretically, one stock at IPO is now equivalent to 1 * 2 * 2 * 2 * 7 = 56 stocks of today. I came across a blog post from Maria Langer and the story that she shared how she her stocks grew since 1997 is totally interesting and inspiring. In the end, I did find a picture of a 1998 Apple stock certificate to show you how expense those stocks could be today if there was not stock split.
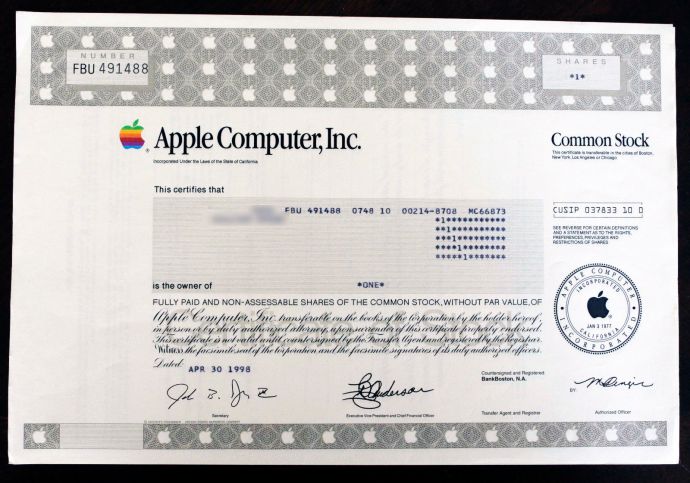
This certificate was issued at Apr, 30, 1998. And there are there has been three split (2*2*7=28) since then. By the market close this Friday, each stock is ~ $165. So if there has never been stock split, you need will need a lump sum of $4620 to just buy one Apple stock. That will totally change the demographics of the investor for Apple, probably only high net wealth individual or institutions will be able to invest, much less liquidity and probably won’t be as successfully as it is today as a house hold name.
Anyhow, like Yahoo finance, its pricing data is adjusted in a way taken stock split into consideration.
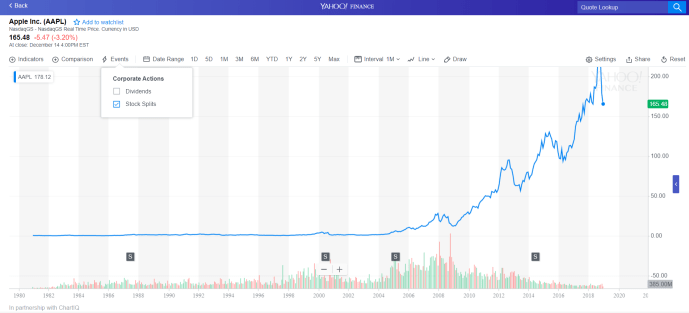
The Apple was IPOed at $22 per share. And in Yahoo Finance, the Dec 1980 price was $0.51, which aligns with the stock split. ($0.51 * 56=$28 ~ $22). People might say “should have I invested $XXX, I would have $YYY today”, the short answer is even if you were an investor at that time, 1980s, it was actually very difficult to see companies like Apple to be a good company to invest.
All those hyper growth looks exciting but let’s compare it with the interest rate. For example, the Fed Interest rate in 1980 was 17.26%. By the time this blog was written, the FED rate is only between 2~3%. If the risk free rate was that high, I really couldn’t imagine how could anyone take the risk and invest their savings into a tech startup with the their CEO dress like college students.
To prove my point, you can pull the FED rate and the risk free holding period return is 523% if you buy T-bill.
That is a mouthful and enough distraction, let’s get back to see if our dataset actually contains the adjusted price. Clearly, the starting price is 42 cents which is far less than $22 in 1984. It is a good indicator that the data downloaded is adjusted.
4. ETL – Database
Even if the data is already in text format and on your disk, my personal preference is to convert that into a format that is easier to deal with like to put into a database. For now, let’s dump it into SQLite. Then, it will be pretty easy to do some analytics or connect with other tools like Python and visualizations tools more easily.

By using Pandas and SQLalchemy, the life now is so easy. Since this conversion requires a lot of disk read and write, it took me a while, about half an hour, so it is a good idea to add in a progress bar and try except logic.
In the end, we ended up with 32 companies somehow got empty file in the txt file which are
['accp', 'amrh', 'amrhw', 'asns', 'bbrx', 'bolt', 'boxl', 'bxg', 'ehr', 'fmax', 'gnst', 'hayu', 'jt', 'mapi', 'molc', 'otg', 'pbio', 'pxus', 'rbio', 'sail', 'sbt', 'scci', 'scph', 'send', 'sfix', 'srva', 'stnl', 'vist', 'vmet', 'wnfm', 'wspt', 'znwaa']
I took a quick look at the Yahoo finance and they do look legit companies some with good history of data, but I guess we will put a pin the question of why they are missing data and focus on the ones that we have.
After all of this, 17 million records for 8507 different public companies (a count distinct took 45 seconds without indexing so be cautious when you play with complex queries) and database is about 1.3 GB.
In the next post, we will do some descriptive analytics and hopefully figure out an efficient way of manipulating the data.
