KITTI is one of the most popular public datasets and industry benchmark when it comes to autonomous driving research. This article will include data explorations for the published dataset so readers will have a more intuitive understanding of how the it is captured and how it should be used.
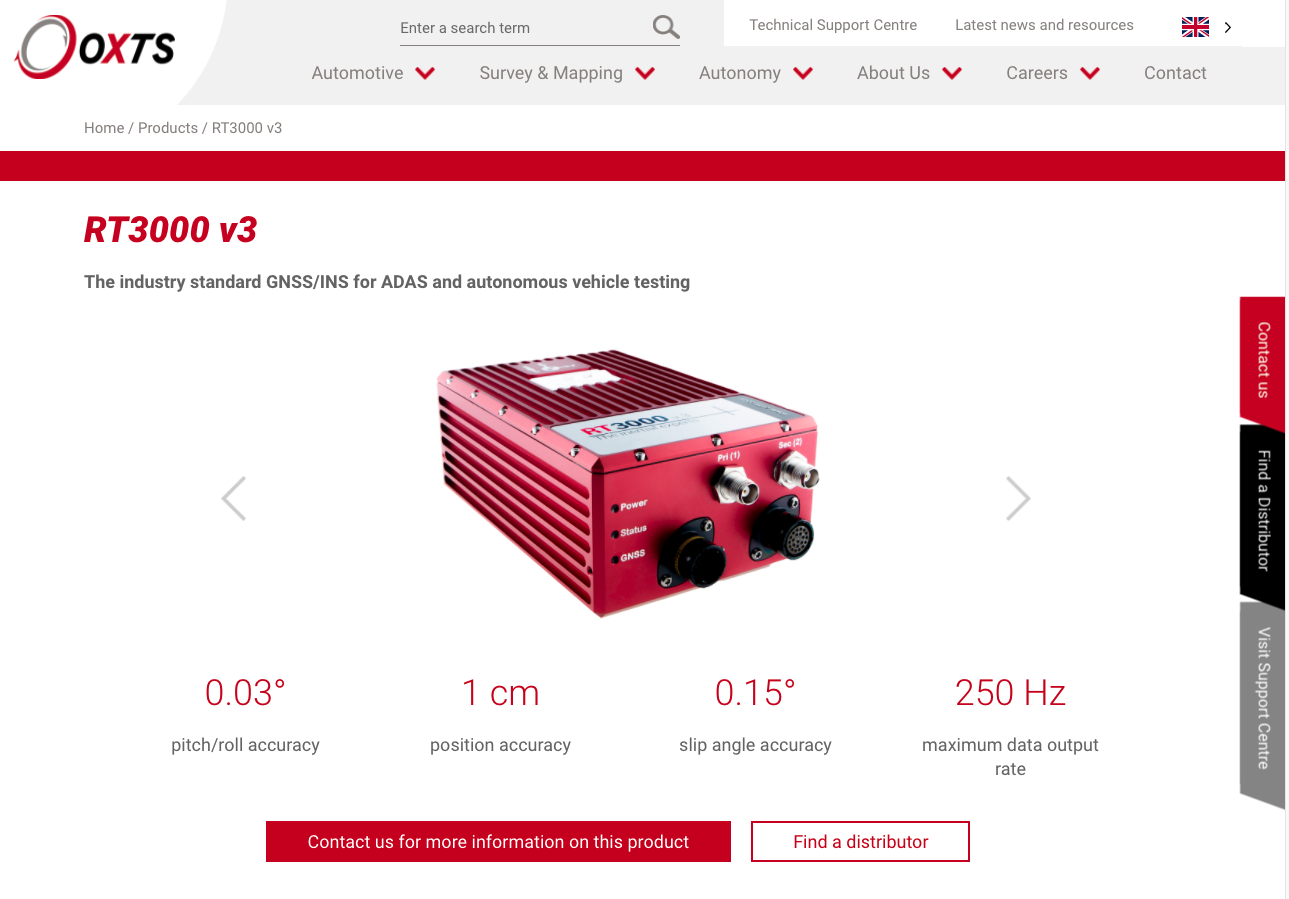
Let’s work backwards by diving straight into the dataset. There is a section of raw data where you can download. In the bottom of the page, you can find different scenaries and linkage to the downloads.
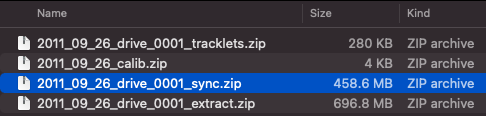
For example, here is one.
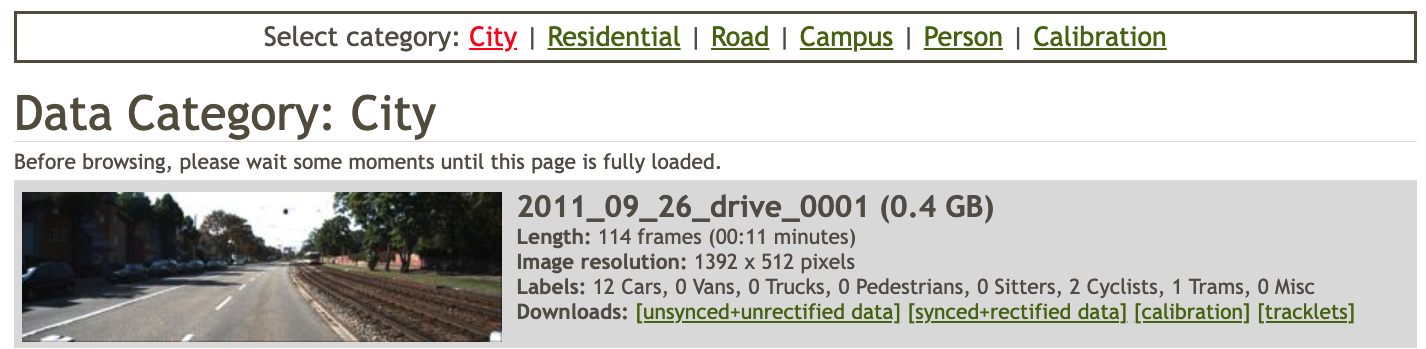
After data is downloaded, we can see there synced data is of size 458MB which is likely the 0.4GB that appears in the title. The extract file is ~50% bigger and probably contains all the raw data points before any processing. The calibration and tracklet are small files.
Calibration
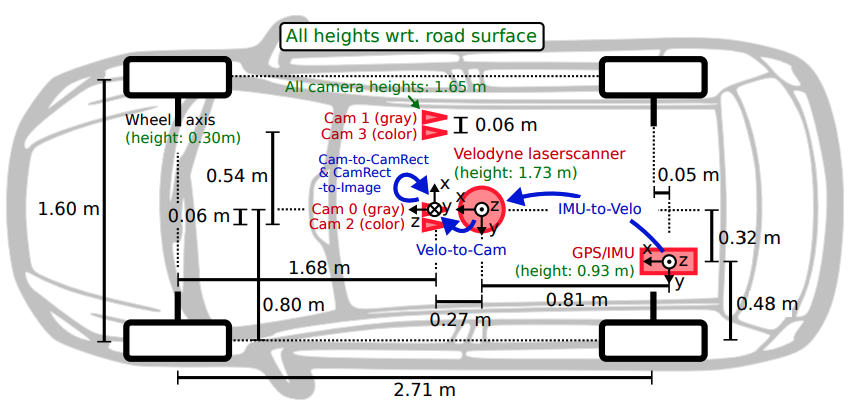
Calibration is the process where you reset your sensors so it is benchmarked or calibrated to a known measurements for accuracy purpose. Just like you have a scale, the calibration is to make sure your scale says 0 without any weight. It is the same for the different sensors in an AV.
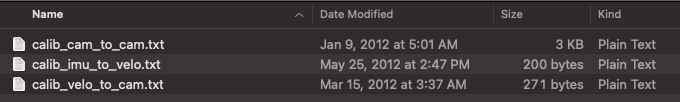
There are 3 small plain text files.
Tracklets
Sync
Extract
Images/Camera
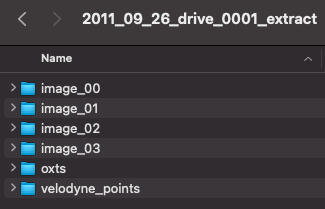
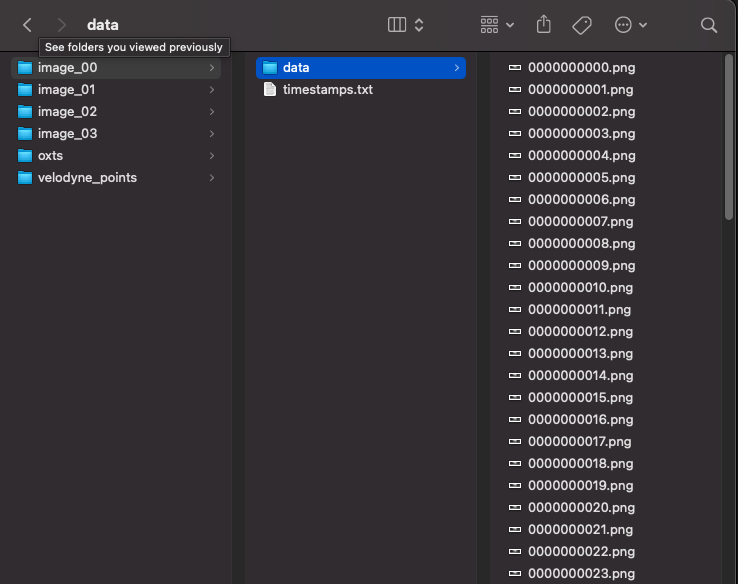
Extract folder contains 6 folders where 4 contains the all the images captured by the cameras, one from lidar and one from the motion sensor.
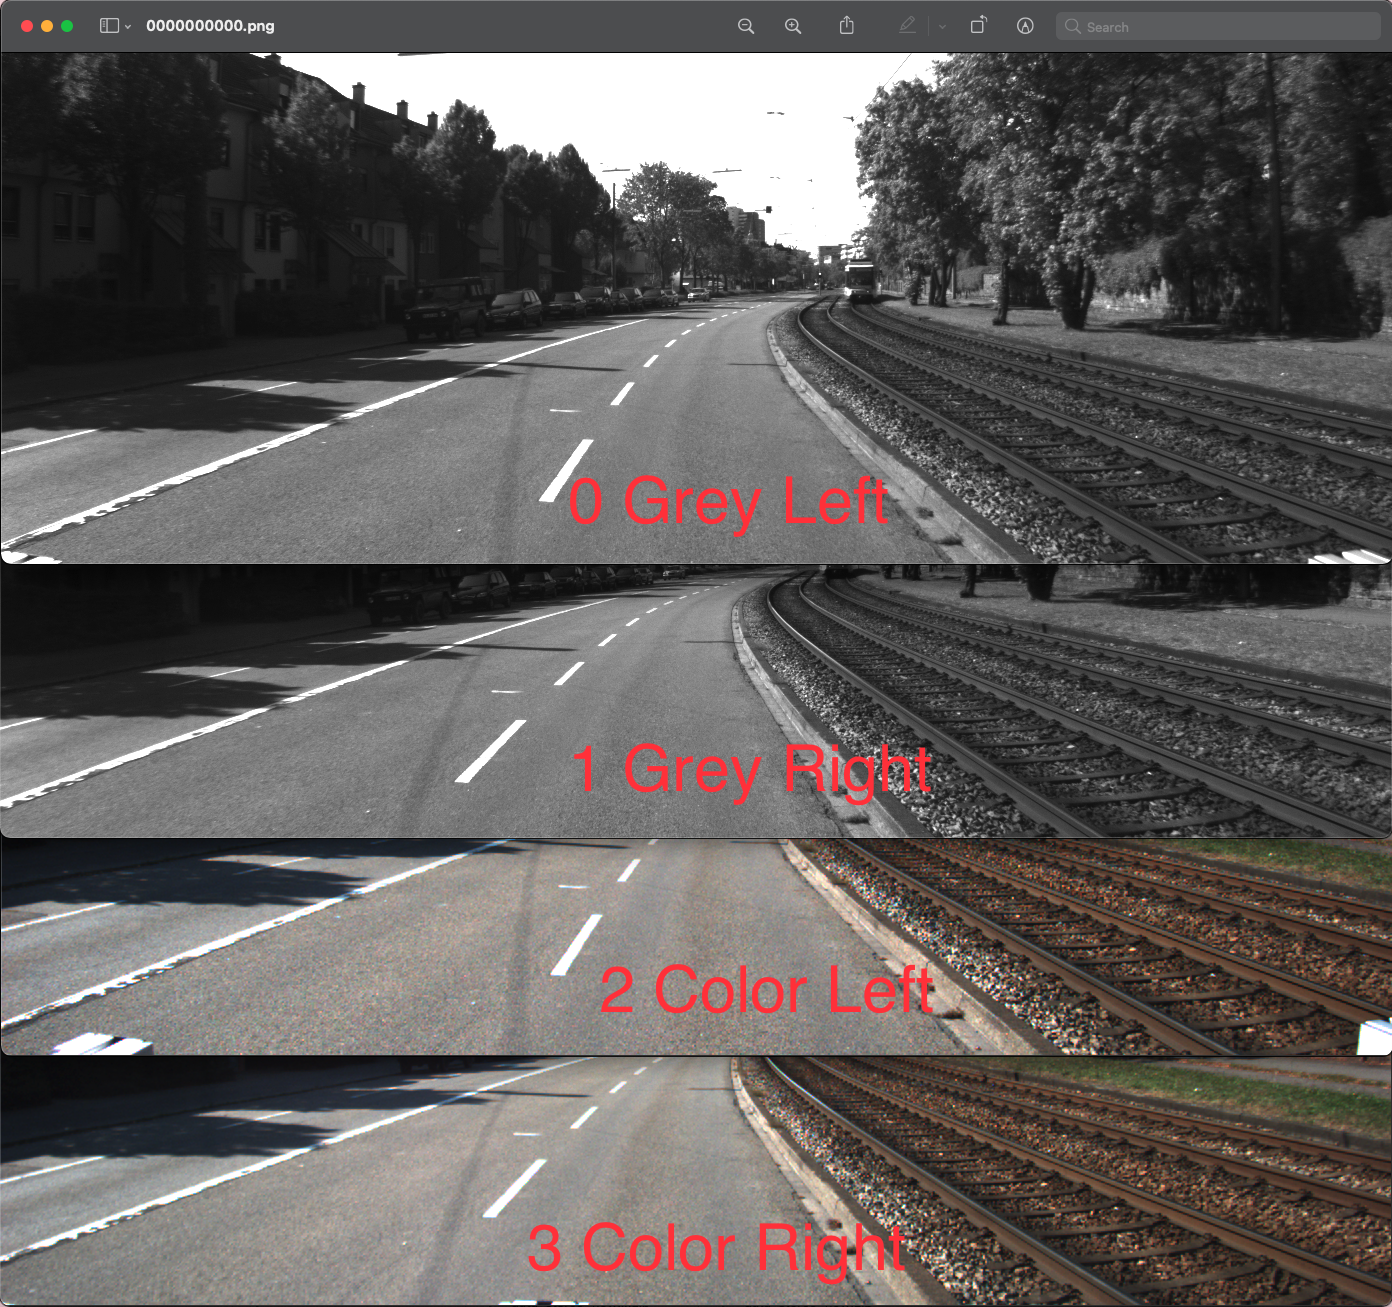
By putting the first image of all the cameras together right next to each other, it is pretty easy to tell the first two are greyscales and next two are color images. Then we can tell the left cameras from the right cameras by comparing its relative distance to some benchmarks like the light rail or road lanes.
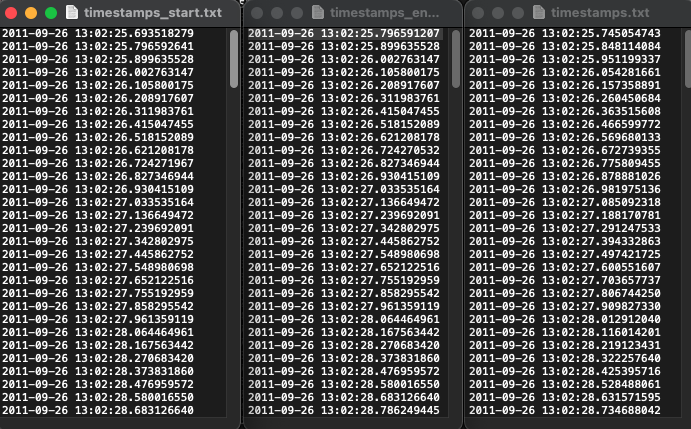
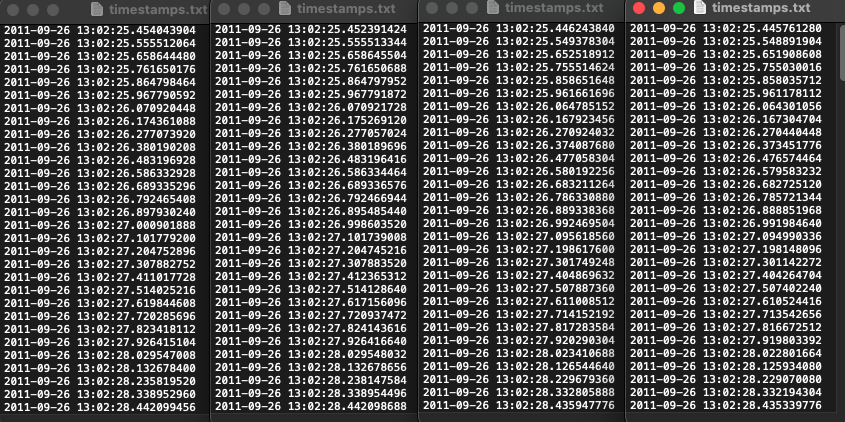
Inside each of the camera folder, there also exists a timestamp text file that stores all the timestamp of when the images were captured. The frequency for each camera were about 10Hz and all cameras seem started capturing “at the same time”, the earliest being 445ms and the latest being 454ms, a nominal difference of 9ms, however, we are not sure if the 4 cameras all share the same clock, and if not, if the 4 clocks are perfectly synced.
IMU (Inertial measurement unit)
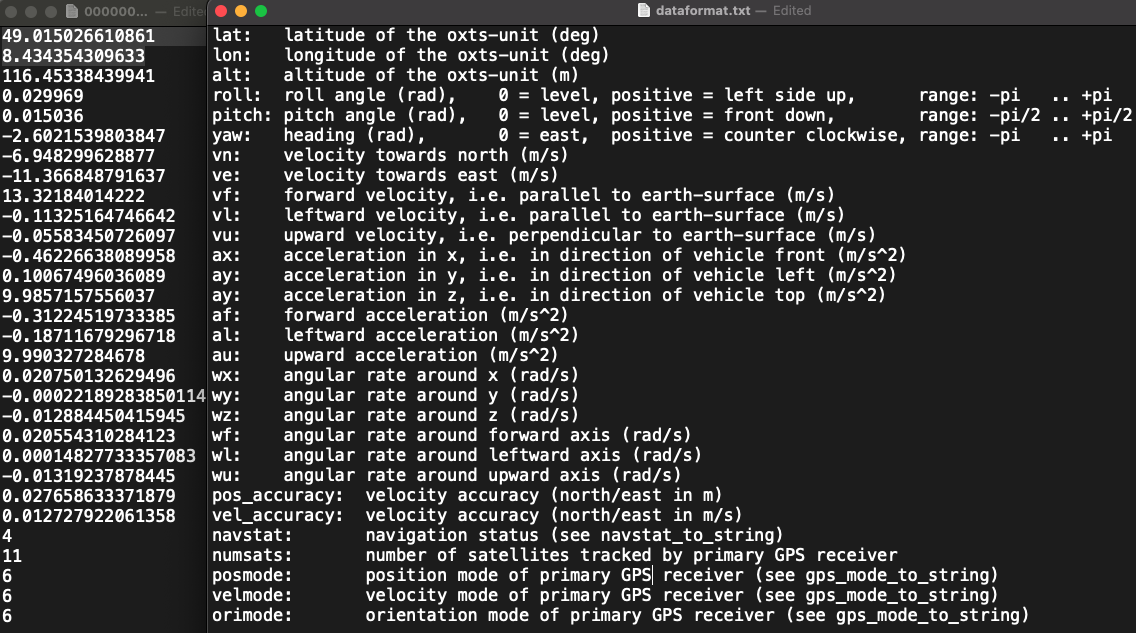
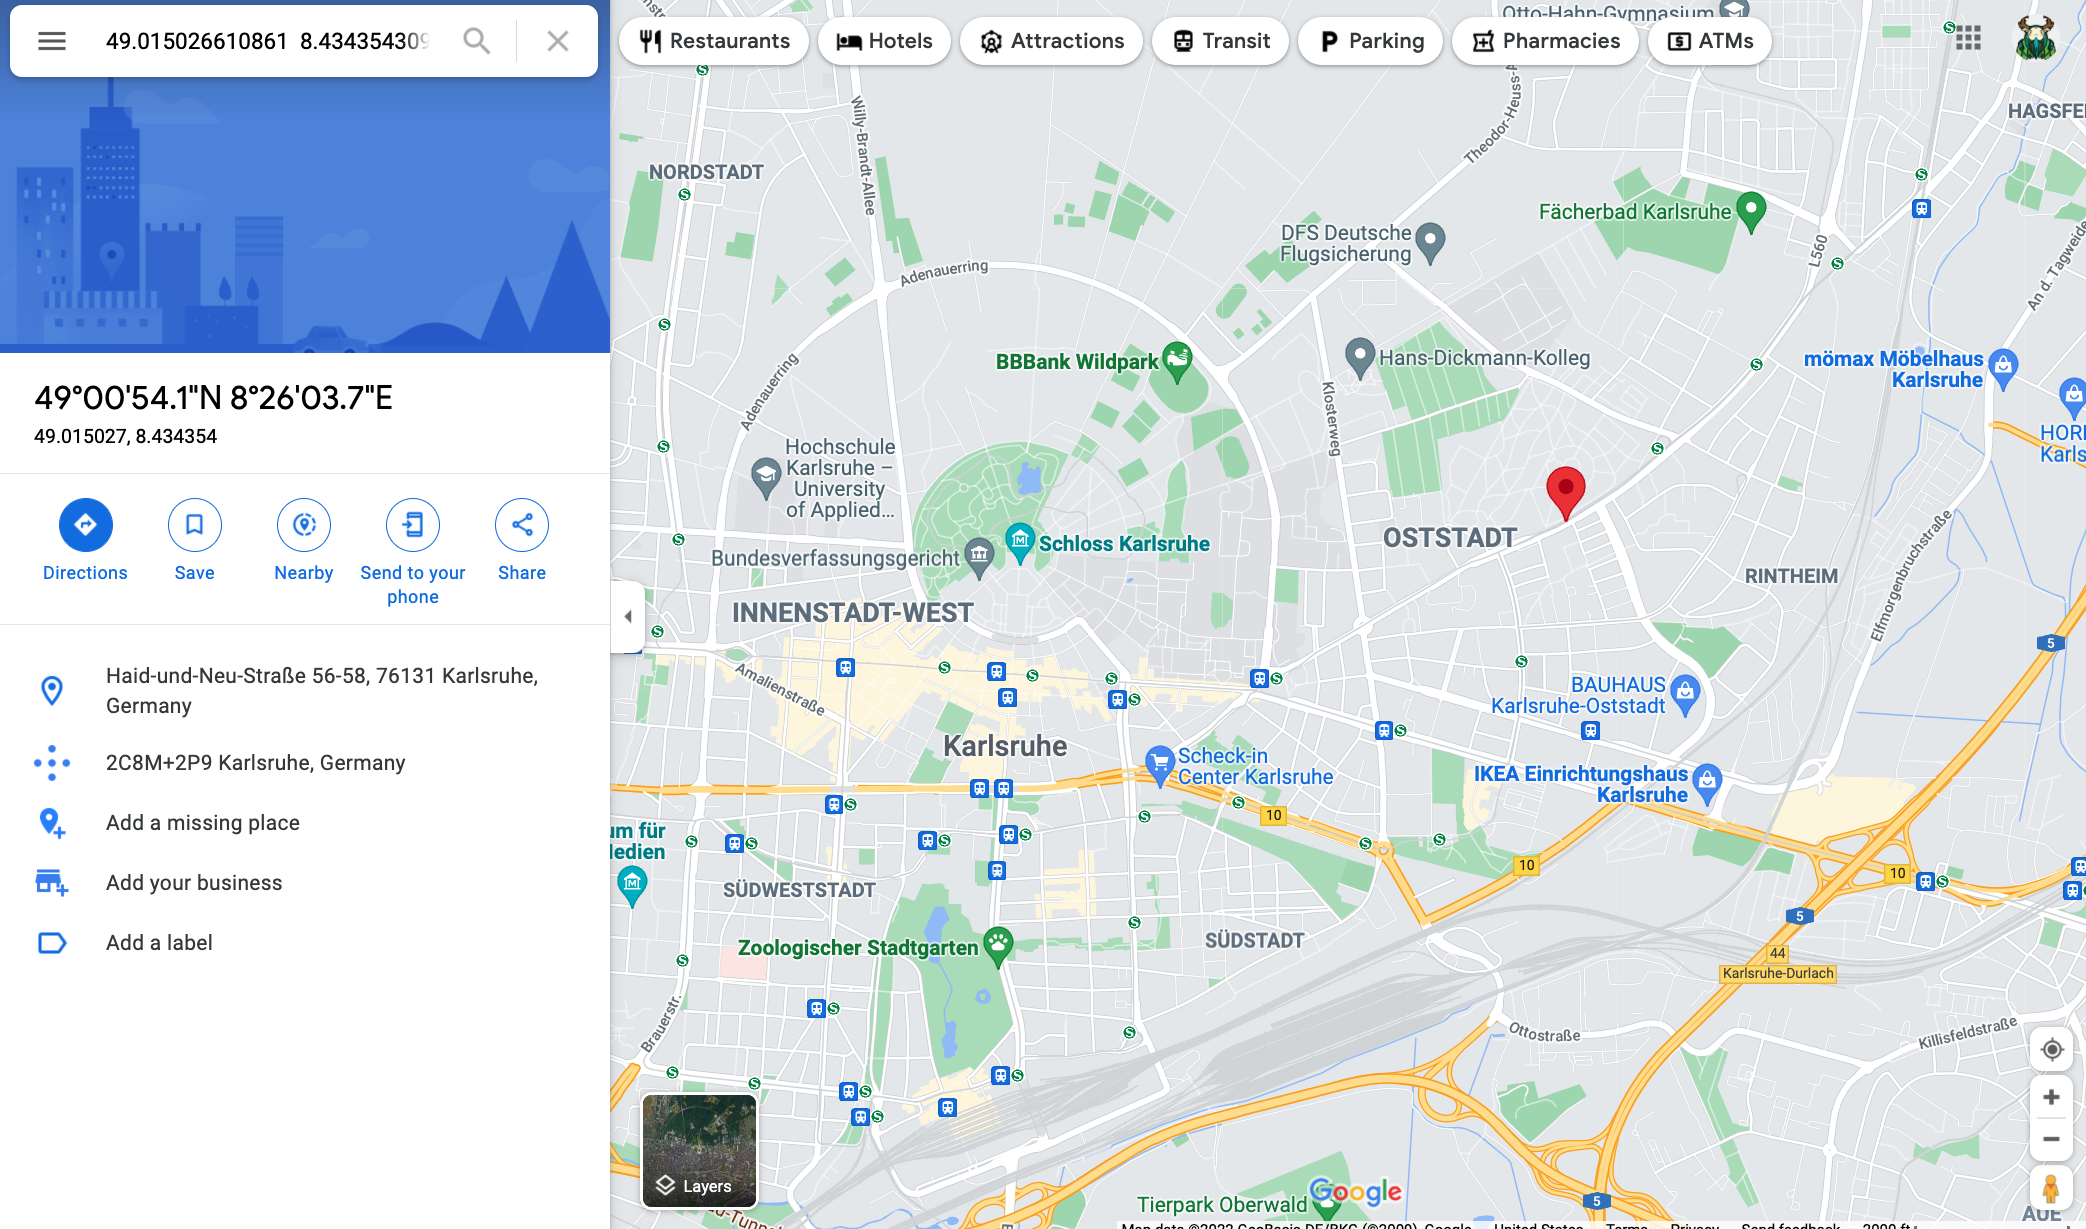
Interestingly, we can see the car is driving north at negative -6.94 and east at negative -11.36, so basically it is driving towards southwest more to the west.
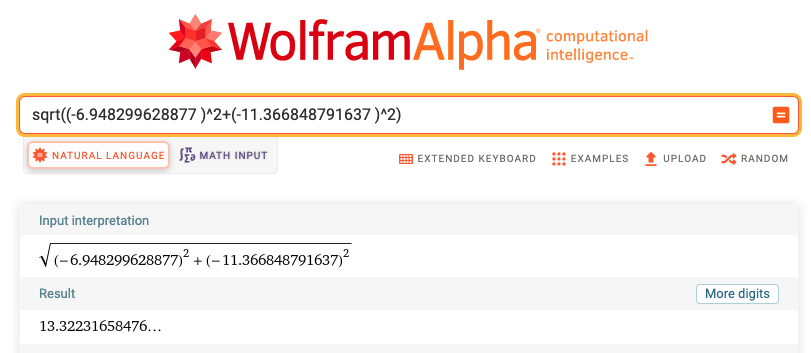
It also matches the forward velocity of 13.32184 captured by the sensor itself, which is about 29 mph or 46 kmph.
Then it showed various types of accelerations.
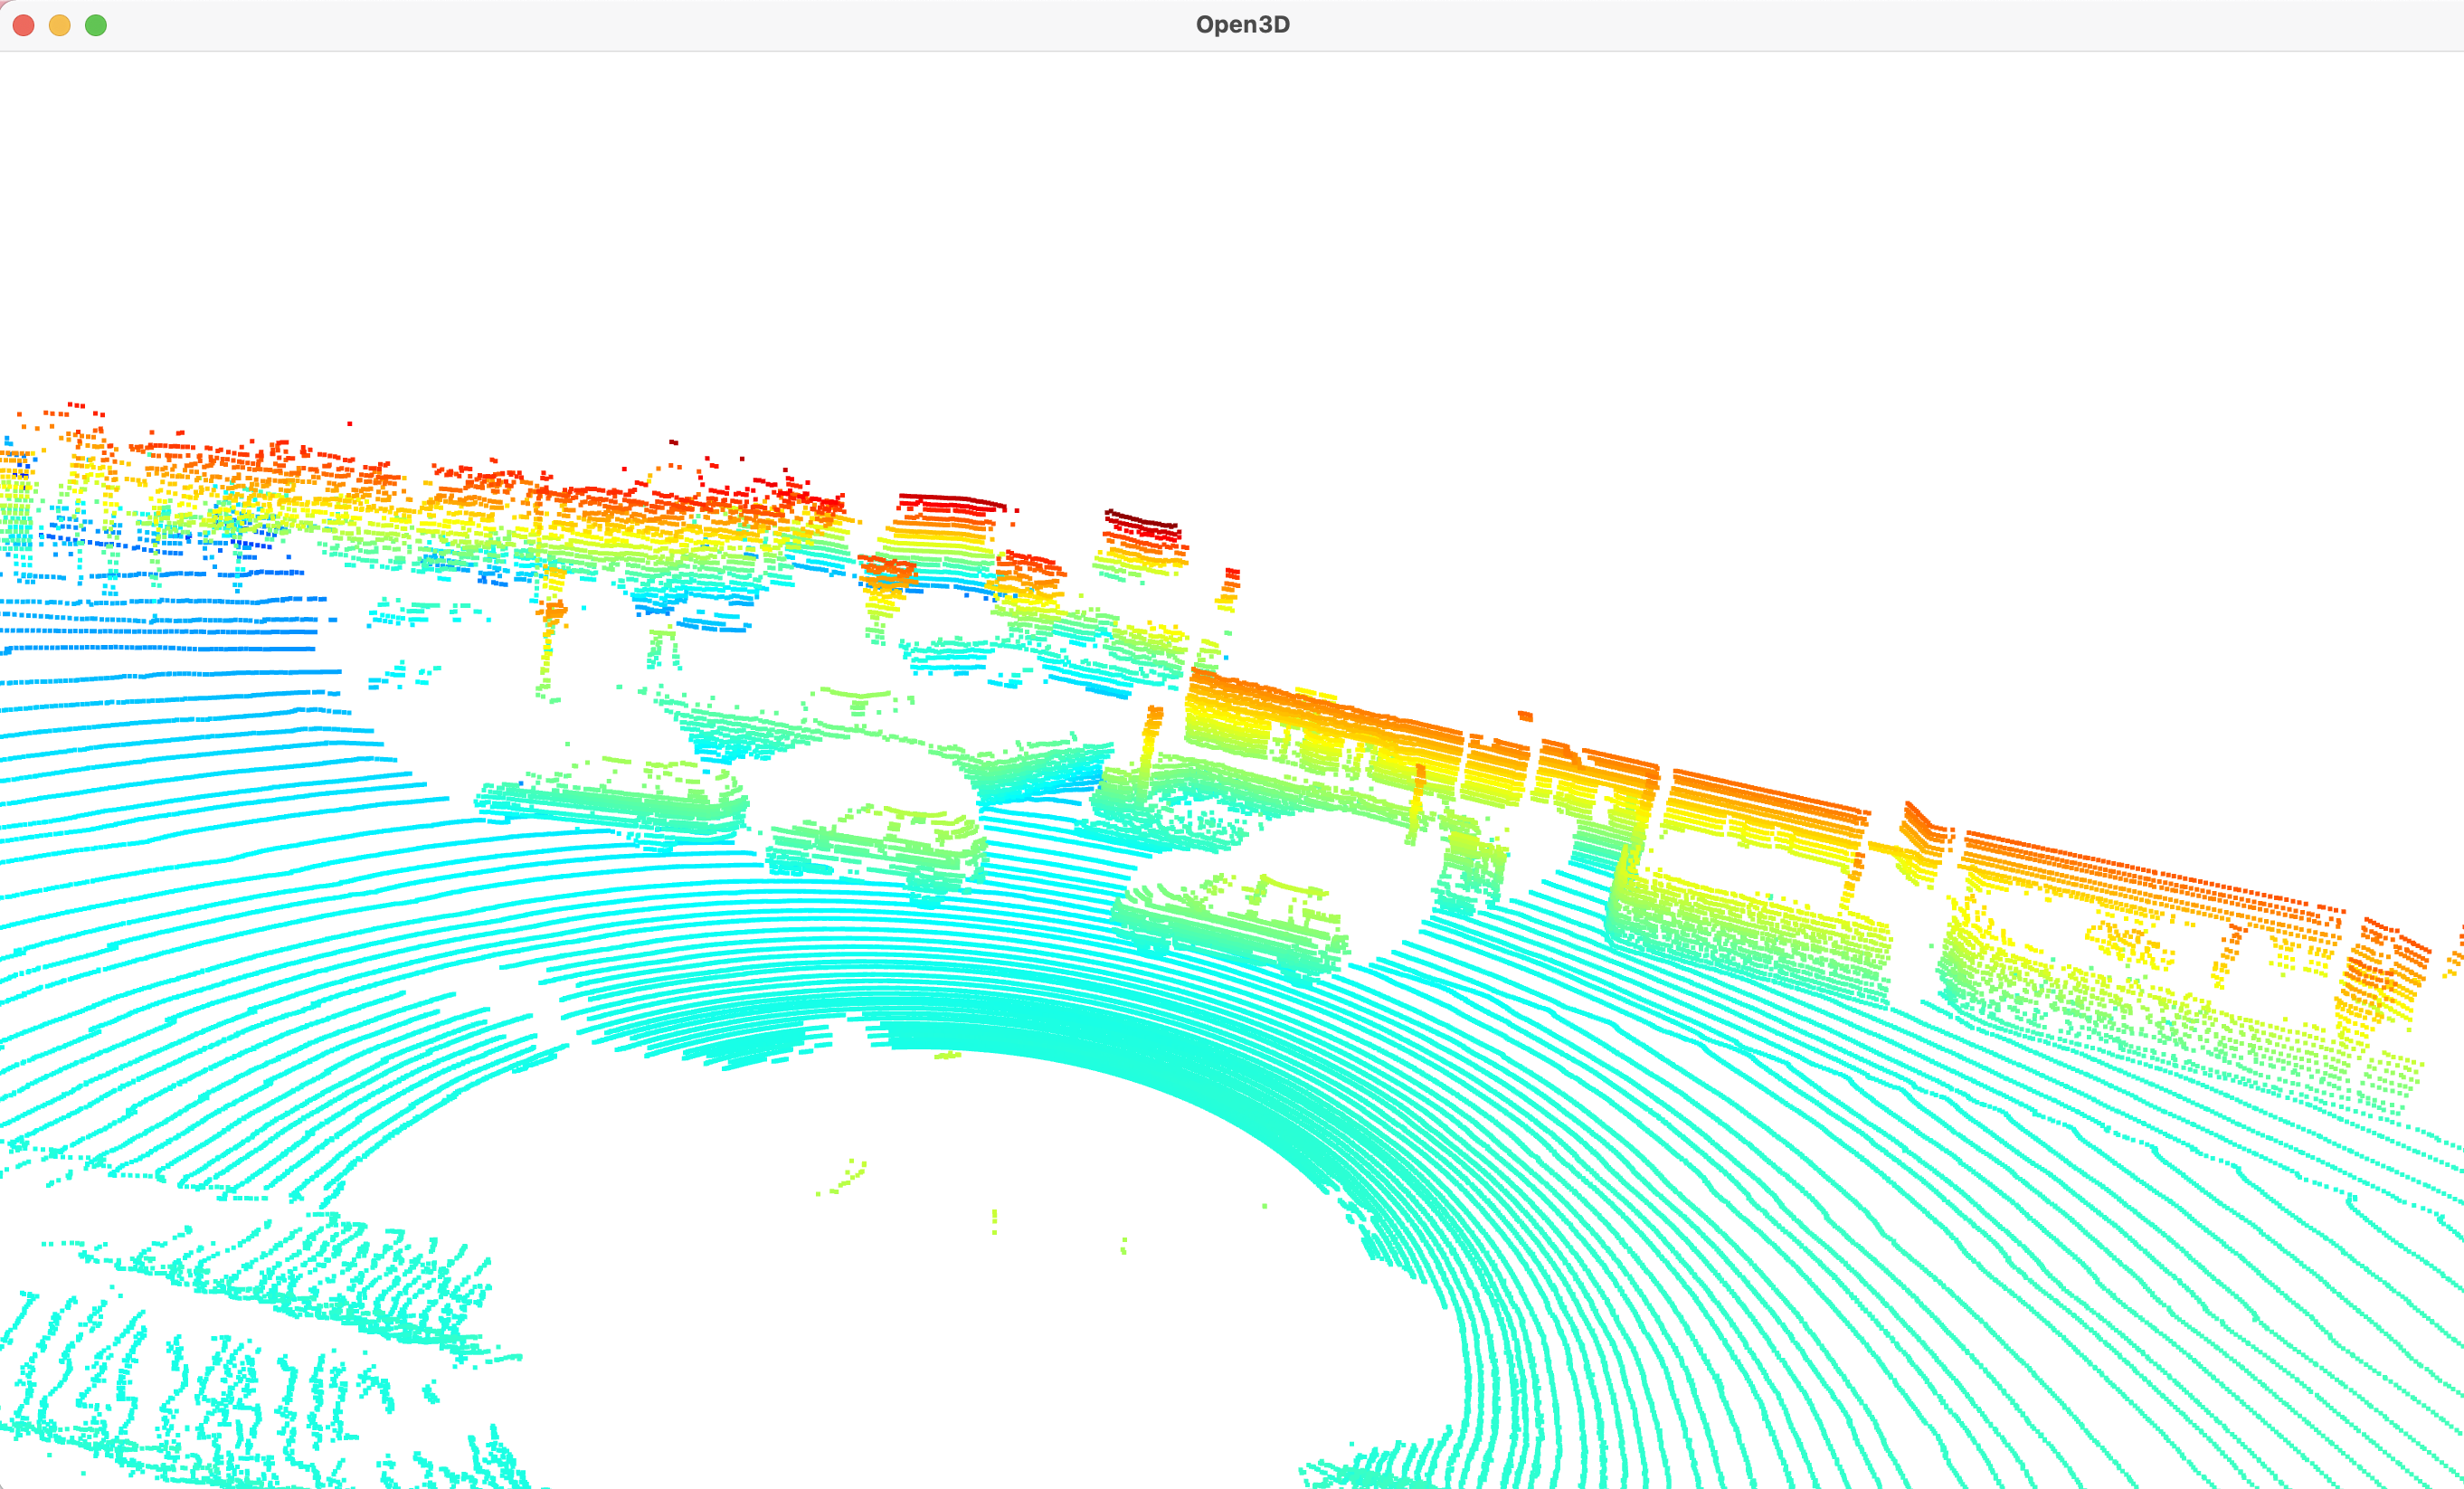
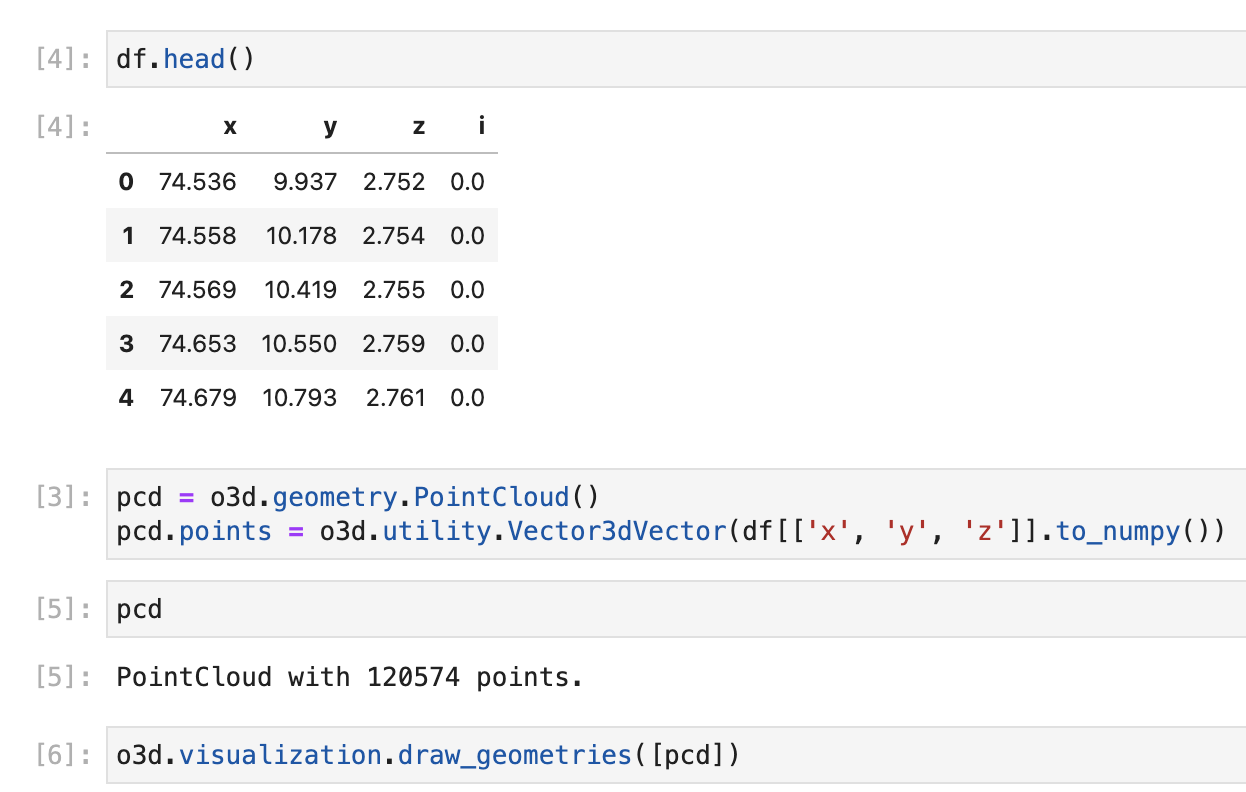
LIDAR / Cloud points
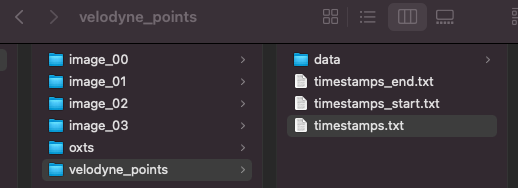
The lidar was also capturing at a 10Hz frequency.